Over the past two decades, social media has transformed from niche online communities into a global network of over 5.8 billion users [Statista]. What started as a way to stay in touch has become a powerful driver of communication, commerce, and culture.
Ecco un fatto divertente:
The average social media user scrolls through about 300 feet of content on their phone every day, that’s roughly the height of The Statue of Liberty! That’s how deeply social platforms are now stitched into our daily lives, reshaping how we connect, learn, and buy. [Fonte]
Ma con le piattaforme che si moltiplicano, le funzionalità che si evolvono e il comportamento degli utenti che cambia di giorno in giorno, come si fa a stare al passo con la curva?
Le risposte si trovano nei dati. E per capire che cosa significhino effettivamente questi dati per i marketer, questo blog è la vostra guida di riferimento per capire che cosa sta funzionando, che cosa sta svanendo e che cosa sta per arrivare nel mondo dei social media.
So, whether you are planning your next campaign, refining your content strategy, or just love a good stat fix, let us break down the numbers that matter.
I social media sono ormai una costante globale. A partire dall'ottobre 2025, 5,66 miliardi di persone sono attivi sulle piattaforme sociali, il che è 68,7% della popolazione mondiale. Non si tratta solo di un fenomeno diffuso, ma quasi universale tra gli utenti di Internet, con 94,2% di utenti internet now on social media. [Statista]
Here’s how the market has evolved and what it means in real numbers:
- Gli utenti dei social media sono cresciuti di 4,87% a/a, adding an average of 7.8 new users every second. [DataReportal Global Digital Report 2025]
- Over the past decade, the growth has been remarkable from over 2 billion users in 2015 to 5.66 billion today. Social media adoption has more than doubled in ten years. [DataReportal Global Digital Report 2025]
| Anno | Utenti in miliardi | Crescita a/a (%) |
| 2025 | 5.31 | +5.4% |
| 2024 | 5.04 | +5.9% |
| 2023 | 4.76 | +3.0% |
| 2022 | 4.62 | +10.0% |
| 2021 | 4.20 | +13.2% |
| 2020 | 3.71 | +7.2% |
| 2019 | 3.46 | +8.1% |
| 2018 | 3.20 | +14.7% |
| 2017 | 2.79 | +20.8% |
| 2016 | 2.31 | +11.1% |
| 2015 | 2.08 | — |
- Il tempo medio giornaliero trascorso sui social media è 2 hours and 21 minutes. [Statista Daily Uses Stats]
- Un utente tipico visita attivamente 6.75 social platforms per month. [DataReportal Global Digital Report 2025]
- Il mondo spende collettivamente oltre 15 miliardi di ore per day on social media. [DataReportal]
- Cina (1,1 miliardi), India (491 milioni) e Stati Uniti (253 milioni). are the top three countries by total social media users. [World Population Review]
Social media penetration by country:
| Paese | Penetrazione dei social media |
| Arabia Saudita | 111.2% |
| EMIRATI ARABI UNITI | 109.7% |
| Corea del Sud | 95% |
| Singapore | 90.6% |
| Cina | 90.3% |
| Malesia | 85% |
| Hong Kong | 84.4% |
| Paesi Bassi | 83.3% |
| Canada | 82.1% |
| Filippine | 81.9% |
- I social media continuano a crescere. Da oltre 5,4 miliardi di utenti nel 2025, si prevede che il numero di utenti attraverserà 6.6 billion users by 2030. [Statista SM Platforms]
With billions logging in daily and spending hours across multiple platforms, the real question becomes, where are they actually spending that time, and how is that time turning into sales?
Quali piattaforme conquisteranno l'attenzione dei consumatori nel 2026?
Social media isn’t just where people scroll it’s where they discover, engage, and shop. For marketers, this shift is critical. This year, platforms like TikTok, Instagram, and Facebook are not only driving traffic but also influencing real buying behavior.
Here are the key signals that show where consumer attention and buying intent is strongest:
- Gen Z leans into TikTok (55%) while Millennials prefer Facebook (52%). [SocialPilot TikTok Trends Report 2025]
- As per Our TikTok Trends Report 2025 analysis of 1.5 million posts, TikTok isn’t just a content platform, it’s a discovery engine. With 1.59 billion monthly users and 135M in the U.S. alone, TikTok is where Gen Z now searches, shops, and sets cultural norms.
- The US social commerce market reached $87 billion in 2025, growing 21.5% year-over-year, and is projected to surpass $100 billion in 2026 on its way to $150 billion by 2029. [Capital One Shopping Research]
- 48% of Gen Z consumers prefer discovering products through short-form videos like TikTok and Instagram Reels. [HubSpot State of Consumer Trends 2024]
- Instagram è la piattaforma preferita per 60% of users for product research, and 37% use it to actually shop. [DataReportal Global Digital Report 2025]
- 87% dei venditori say social selling has positively impacted their business. [HubSpot State of Sales Report]
- Le vendite guidate dai social network rappresentano oggi 17.11% of all online sales. [DataReportal Global Digital Report 2025]
- 35% of social media users shop on social platforms at least once a week. [Morning Consult, 2025]
- Il mobile continua a dominare: $577.6 billion in US mobile ecommerce sales in 2025, making up over 44% of all ecommerce sales. [Capital One Shopping eCommerce]
- Il sociale è il punto di partenza: 14% of consumers begin their online shopping journey on social media. [DataReportal Global Digital Report 2025]
- TikTok Shop captured 18.2% of total US social commerce in 2025, generating $15.82 billion in sales, a 108% year-over-year increase. [Capital One Shopping Stats]
Now that we know where consumers are spending and spending money, let’s break down who’s actually driving this behavior.
- I social media continuano ad essere dominati dal pubblico più giovane, con over 70% of users globally falling between the ages of 18 and 34. [DataReportal Global Digital Report 2025]
- Gen Z (ages 18–24) alone makes up 36,2% della base utenti di TikTok, mentre Il gruppo demografico più numeroso di Instagram ha un'età compresa tra i 25 e i 34 anni., contabilità per 29.7% of U.S. users. [Statista US users]
Nota: Visual discovery platforms like Pinterest and Instagram attract a higher share of female users, while networks like X, LinkedIn, and Bluesky are more male-dominant. Platform demographics continue to evolve as new features attract more diverse user segments.
People across the globe collectively spend oltre 15 miliardi di ore every day on social media, proof of how deeply integrated these platforms have become in how we connect, consume, and communicate. [DataReportal]
Analizziamo i comportamenti specifici che modellano il modo in cui gli utenti si impegnano quotidianamente sulle piattaforme sociali:
- 50.2% of social media users primarily use platforms to keep in touch with friends and family. [DataReportal Global Digital Report 2025]
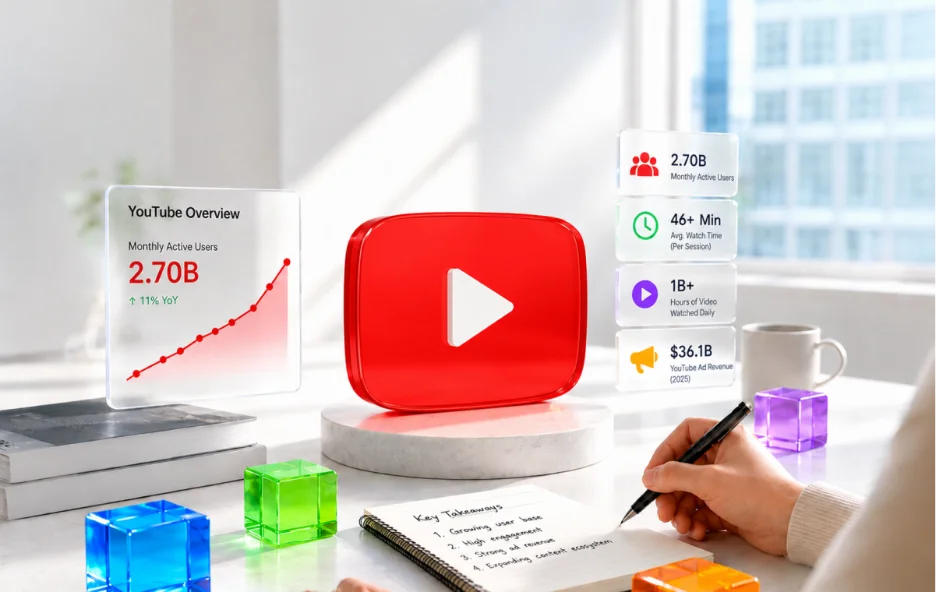
- Globally, users spend over 27 hours per month on the YouTube mobile app. [Statista time stats]
- The average Bluesky visit lasts 10 minutes and 35 seconds, compared to 12 minutes on X. [ExplodingTopics, citing SimilarWeb data, November 2024]
- 57% of LinkedIn traffic comes from mobile devices. [LinkedIn Business]
- 82-85% di Pinterest usage is on mobile. [Pinterest Business]
- Instagram users spend an average of 30 minutes daily on the app. [Statista Instagram Avg Time]
- Snapchat users also spend an average of 30 minutes per day on the app. [Snap Inc. investor report]
Now that we know how embedded social media is in everyday routines, the next step is understanding what truly captures users’ attention and keeps them engaged.
Quale tipo di contenuto genera il maggior coinvolgimento?
Nel 2026, il video continua a dominare, e i contenuti di breve durata sono in testa alla classifica. Che si tratti di clip di TikTok, di Instagram Reels o di corti di YouTube, gli utenti si impegnano maggiormente con formati dinamici e coinvolgenti.
- Posts with videos on Instagram get 49% more engagement than photo posts. [SocialPilot TikTok Trends Report 2025]
- On LinkedIn, video drives 3-5x more engagement than other formats. [StoryKit Article]
- Educational creators on TikTok see engagement rates of up to 9.5%. [SocialPilot TikTok Trends Report 2025]
Nota: Engagement rates vary widely by platform. Instagram leads due to interactive content formats, while TikTok and Pinterest benefit from personalized, discovery-driven use.
More than format, user behavior across platforms reveals what truly hooks attention:
- TikTok leads for entertainment, 79,6% di utenti seek funny or engaging videos. [DataReportal Global Digital Report 2025]
- Instagram dominates visual sharing, 69,8% di utenti post photos or videos. Facebook remains a hub for connection, 72.1% use it to message friends and family. [DataReportal Global Digital Report 2025]
Social media has evolved into more than just a marketing channel, it’s now a core business engine. Over 87% of businesses report that social media has positively impacted their business. [HubSpot State of Sales Report]
Here are more business-driven stats:
- Facebook Marketplace is used by over 250 million sellers globally. [Meta official]
- 90% degli utenti di Instagram follow at least one business account, and 61% use the platform to discover new products. [Meta official]
- LinkedIn is home to over 67 million companies, and 4 out of 5 users drive business decisions. [LinkedIn official]
- TikTok helped small and medium-sized businesses generate $14.7 billion in 2024 alone. [TikTok SMB Impact Report]
- According to SocialPilot’s 2025 TikTok Trends Report, business accounts that post weekly, especially with 31–60 second videos, outperform peers, achieving up to 2.11% reach and 3x more engagement than horizontal formats._
- Pinterest drives 33% more referral traffic to ecommerce sites than Facebook. Pinterest delivers 2x higher ROAS than other digital platforms. [Pinterest Business]
- Snapchat+ subscription revenue reached approximately $500 million annually. [Snap Inc. investor report]
- YouTube is used by 51.6% of marketers primarily for brand awareness, with 43.3% reporting improved product visibility. [HubSpot State of Marketing Report]
With social platforms now central to sales, service, and storytelling, the question is no longer, if your business should be online, but how effectively you’re using it.
Quali sono le piattaforme che offrono la migliore portata pubblicitaria e il miglior ROI?
YouTube è in testa con la più alta portata pubblicitaria potenziale a 2,54 miliardi di utenti, seguito da vicino da Facebook at 2.28 billion. [Meta official / YouTube Advertising]
Ecco le principali statistiche pubblicitarie che vale la pena conoscere:
- Instagram’s ad revenue hit $71 billion by the end of 2025, with Reels between 60–90 seconds driving 24% more shares. [Statista Insta Ads]
- Pinterest delivers 2x higher ROAS than Facebook and Instagram ads and reaches 340 million people via advertising. [Pinterest Business]
- TikTok’s total global ad revenue is projected at $33.1 billion in 2025, up from $23.6 billion in 2024, with a 67% click-through rate on traffic campaigns. [Statista TikTok Ad]
- LinkedIn ads increase purchase intent by 33%, making it ideal for high-value B2B conversions. [LinkedIn Audience]
- Snapchat’s ad reach hit 709 million users, and its advertiser base more than doubled in Q4 2024. [Snap Inc. investor report]
- X (formerly Twitter) is expected to generate $2.26 billion in global ad sales in 2025, marking its first year of ad revenue growth since Elon Musk’s acquisition. [Reuters]
From massive reach to laser-focused B2B targeting, social platforms in 2026 aren’t just ad spaces, they’re business growth ecosystems.
Social media is already moving fast, but what’s coming next will challenge marketers to be sharper, faster, and more data-informed. With audiences fragmenting, AI reshaping creation, and commerce blending directly into content, the next wave is about smarter strategy, not more platforms.
1. L'ascesa dei contenuti generati dall'intelligenza artificiale e guidati dai creatori
- 93% di marketer plan to increase or maintain investment in video content, especially short-form and AI-enhanced formats. [HubSpot State of Marketing Report]
- AI tools are reshaping content creation, recommendations, and campaign automation across every major platform.
- Il mercato del social commerce negli Stati Uniti è destinato a superare $150 billion by 2029. [Capital One Shopping Research]
- 67% of social media users say they’ve purchased a product they discovered in a brand’s social media post. [LendingTree Consumer Survey, December 2025]
3. La frammentazione sta spingendo le comunità di nicchia
- L'utente medio visita 6,8 piattaforme mensili, seeking more tailored content experiences. [DataReportal Global Digital Report 2025]
- Piattaforme emergenti come Bluesky e Discordia attirano un pubblico alla ricerca di connessioni più strette e meno rumore algoritmico.
4. La messaggistica è il nuovo canale di marketing
- WhatsApp Business e Messaggero sono sempre più utilizzati per l'assistenza ai clienti, la scoperta dei prodotti e le offerte personalizzate.
- Private, one-on-one interactions are increasingly dominating engagement strategies.
5. ROI, attribuzione ed efficienza della spesa pubblicitaria al centro della scena
- As CPMs and CPCs rise, marketers are doubling down on performance analytics, attribution tracking, and channel-specific ROI.
- Ad budgets are shifting from broad reach to high-intent micro-targeting.
Conclusione
The aforementioned social media statistics are more than just numbers, they are signals. They show where your audience is, what they care about, and how they are interacting with brands in 2026. Whether you are planning your next campaign, testing ad formats, or rethinking your posting strategy, this data gives you the clarity to act with confidence.
Per gestire efficacemente tutte queste informazioni è necessario lo strumento giusto. È qui che SocialPilot social media management tool fits in, bringing scheduling, analytics, collaboration, and reporting together so you can turn trends and insights into real growth.
So go ahead, turn those stats into strategy and let us help you scale it.