Over the past two decades, social media has transformed from niche online communities into a global network of over 5.8 billion users [Statista]. What started as a way to stay in touch has become a powerful driver of communication, commerce, and culture.
Here’s a Fun Fact:
The average social media user scrolls through about 300 feet of content on their phone every day, that’s roughly the height of The Statue of Liberty! That’s how deeply social platforms are now stitched into our daily lives, reshaping how we connect, learn, and buy. [Source]
But with platforms multiplying, features evolving, and user behavior shifting by the day, how do you stay ahead of the curve?
The answers lie in data. And in understanding what that data actually means for marketers, this blog is your go-to guide of what is working, what is fading, and what is coming next in the world of social media.
So, whether you are planning your next campaign, refining your content strategy, or just love a good stat fix, let us break down the numbers that matter.
Social media is now a global constant. As of October 2025, 5.66 billion people are active on social platforms, which is 68.7% of the world’s population. This isn’t just widespread; it’s almost universal among internet users, with 94.2% of internet users now on social media. [Statista]
Here’s how the market has evolved and what it means in real numbers:
- Social media users grew by 4.87% YoY, adding an average of 7.8 new users every second. [DataReportal Global Digital Report 2025]
- Over the past decade, the growth has been remarkable from over 2 billion users in 2015 to 5.66 billion today. Social media adoption has more than doubled in ten years. [DataReportal Global Digital Report 2025]
| Year | Users in Billion | YoY Growth (%) |
| 2025 | 5.31 | +5.4% |
| 2024 | 5.04 | +5.9% |
| 2023 | 4.76 | +3.0% |
| 2022 | 4.62 | +10.0% |
| 2021 | 4.20 | +13.2% |
| 2020 | 3.71 | +7.2% |
| 2019 | 3.46 | +8.1% |
| 2018 | 3.20 | +14.7% |
| 2017 | 2.79 | +20.8% |
| 2016 | 2.31 | +11.1% |
| 2015 | 2.08 | — |
- The average daily time spent on social media is 2 hours and 21 minutes. [Statista Daily Uses Stats]
- A typical user actively visits 6.75 social platforms per month. [DataReportal Global Digital Report 2025]
- The world collectively spends over 15 billion hours per day on social media. [DataReportal]
- China (1.1B), India (491M), and the U.S. (253M) are the top three countries by total social media users. [World Population Review]
Social media penetration by country:
| Country | Social Media Penetration |
| Saudi Arabia | 111.2% |
| UAE | 109.7% |
| South Korea | 95% |
| Singapore | 90.6% |
| China | 90.3% |
| Malaysia | 85% |
| Hong Kong | 84.4% |
| Netherlands | 83.3% |
| Canada | 82.1% |
| Philippines | 81.9% |
- Social media is still growing. From over 5.4 billion users in 2025, the number is projected to cross 6.6 billion users by 2030. [Statista SM Platforms]
With billions logging in daily and spending hours across multiple platforms, the real question becomes, where are they actually spending that time, and how is that time turning into sales?
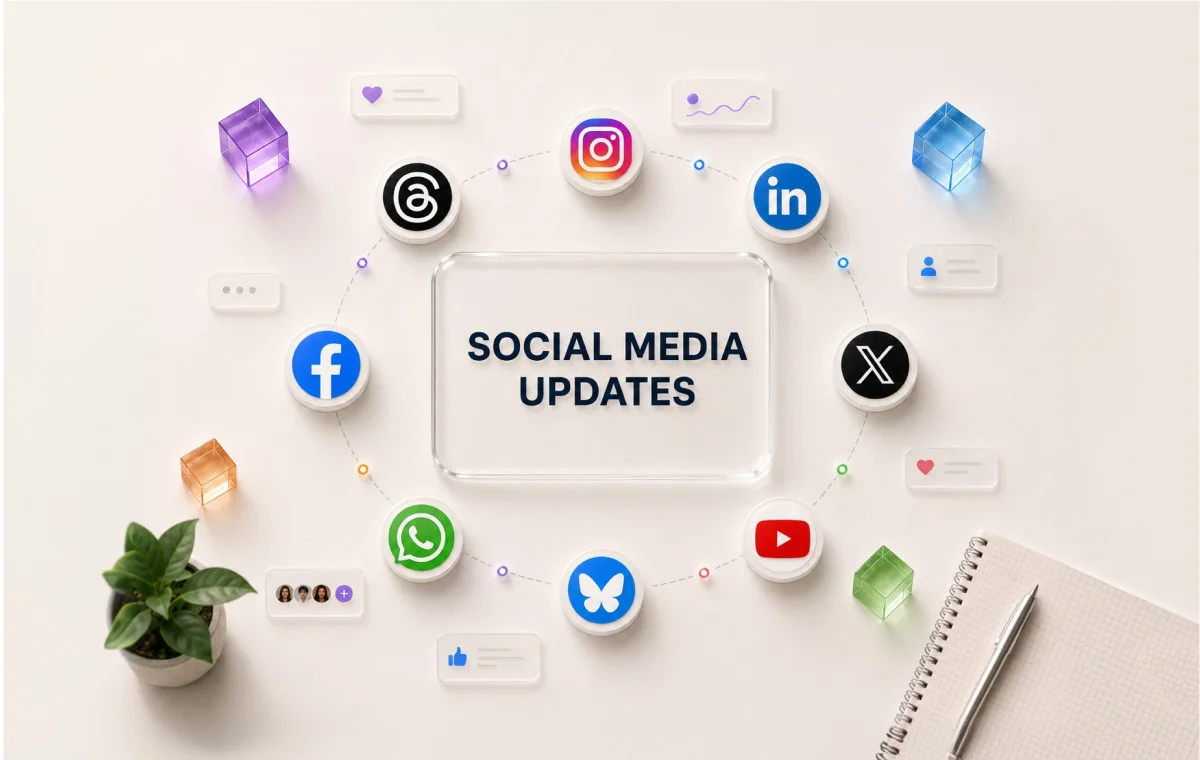
Which Platforms Are Winning Consumer Attention in 2026?
Social media isn’t just where people scroll it’s where they discover, engage, and shop. For marketers, this shift is critical. This year, platforms like TikTok, Instagram, and Facebook are not only driving traffic but also influencing real buying behavior.
Here are the key signals that show where consumer attention and buying intent is strongest:
- Gen Z leans into TikTok (55%) while Millennials prefer Facebook (52%). [SocialPilot TikTok Trends Report 2025]
- As per Our TikTok Trends Report 2025 analysis of 1.5 million posts, TikTok isn’t just a content platform, it’s a discovery engine. With 1.59 billion monthly users and 135M in the U.S. alone, TikTok is where Gen Z now searches, shops, and sets cultural norms.
- The US social commerce market reached $87 billion in 2025, growing 21.5% year-over-year, and is projected to surpass $100 billion in 2026 on its way to $150 billion by 2029. [Capital One Shopping Research]
- 48% of Gen Z consumers prefer discovering products through short-form videos like TikTok and Instagram Reels. [HubSpot State of Consumer Trends 2024]
- Instagram is the preferred platform for 60% of users for product research, and 37% use it to actually shop. [DataReportal Global Digital Report 2025]
- 87% of sellers say social selling has positively impacted their business. [HubSpot State of Sales Report]
- Social network-driven sales now represent 17.11% of all online sales. [DataReportal Global Digital Report 2025]
- 35% of social media users shop on social platforms at least once a week. [Morning Consult, 2025]
- Mobile continues to dominate: $577.6 billion in US mobile ecommerce sales in 2025, making up over 44% of all ecommerce sales. [Capital One Shopping eCommerce]
- Social is the starting point: 14% of consumers begin their online shopping journey on social media. [DataReportal Global Digital Report 2025]
- TikTok Shop captured 18.2% of total US social commerce in 2025, generating $15.82 billion in sales, a 108% year-over-year increase. [Capital One Shopping Stats]
Now that we know where consumers are spending and spending money, let’s break down who’s actually driving this behavior.
- Social media continues to be dominated by younger audiences, with over 70% of users globally falling between the ages of 18 and 34. [DataReportal Global Digital Report 2025]
- Gen Z (ages 18–24) alone makes up 36.2% of TikTok’s user base, while Instagram’s largest demographic is aged 25–34, accounting for 29.7% of U.S. users. [Statista US users]
Note: Visual discovery platforms like Pinterest and Instagram attract a higher share of female users, while networks like X, LinkedIn, and Bluesky are more male-dominant. Platform demographics continue to evolve as new features attract more diverse user segments.
People across the globe collectively spend over 15 billion hours every day on social media, proof of how deeply integrated these platforms have become in how we connect, consume, and communicate. [DataReportal]
Let’s look at the specific behaviors shaping how users engage with social platforms every day:
- 50.2% of social media users primarily use platforms to keep in touch with friends and family. [DataReportal Global Digital Report 2025]
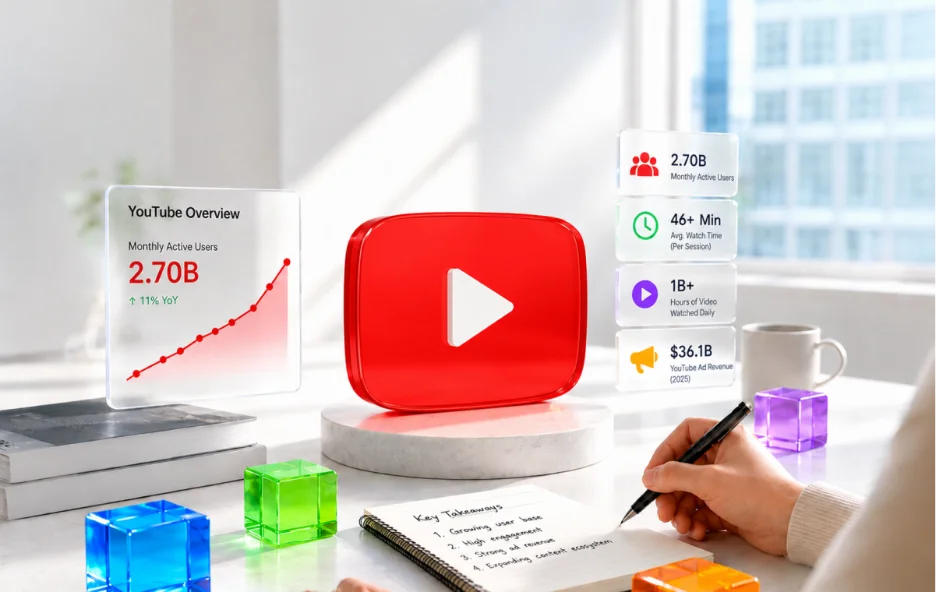
- Globally, users spend over 27 hours per month on the YouTube mobile app. [Statista time stats]
- The average Bluesky visit lasts 10 minutes and 35 seconds, compared to 12 minutes on X. [ExplodingTopics, citing SimilarWeb data, November 2024]
- 57% of LinkedIn traffic comes from mobile devices. [LinkedIn Business]
- 82–85% of Pinterest usage is on mobile. [Pinterest Business]
- Instagram users spend an average of 30 minutes daily on the app. [Statista Instagram Avg Time]
- Snapchat users also spend an average of 30 minutes per day on the app. [Snap Inc. investor report]
Now that we know how embedded social media is in everyday routines, the next step is understanding what truly captures users’ attention and keeps them engaged.
What Type of Content Drives the Most Engagement?
In 2026, video continues to dominate, and short-form content is leading the charge. Whether it’s TikTok clips, Instagram Reels, or YouTube Shorts, users are engaging more with dynamic, immersive formats.
- Posts with videos on Instagram get 49% more engagement than photo posts. [SocialPilot TikTok Trends Report 2025]
- On LinkedIn, video drives 3-5x more engagement than other formats. [StoryKit Article]
- Educational creators on TikTok see engagement rates of up to 9.5%. [SocialPilot TikTok Trends Report 2025]
Note: Engagement rates vary widely by platform. Instagram leads due to interactive content formats, while TikTok and Pinterest benefit from personalized, discovery-driven use.
More than format, user behavior across platforms reveals what truly hooks attention:
- TikTok leads for entertainment, 79.6% of users seek funny or engaging videos. [DataReportal Global Digital Report 2025]
- Instagram dominates visual sharing, 69.8% of users post photos or videos. Facebook remains a hub for connection, 72.1% use it to message friends and family. [DataReportal Global Digital Report 2025]
Social media has evolved into more than just a marketing channel, it’s now a core business engine. Over 87% of businesses report that social media has positively impacted their business. [HubSpot State of Sales Report]
Here are more business-driven stats:
- Facebook Marketplace is used by over 250 million sellers globally. [Meta official]
- 90% of Instagram users follow at least one business account, and 61% use the platform to discover new products. [Meta official]
- LinkedIn is home to over 67 million companies, and 4 out of 5 users drive business decisions. [LinkedIn official]
- TikTok helped small and medium-sized businesses generate $14.7 billion in 2024 alone. [TikTok SMB Impact Report]
- According to SocialPilot’s 2025 TikTok Trends Report, business accounts that post weekly, especially with 31–60 second videos, outperform peers, achieving up to 2.11% reach and 3x more engagement than horizontal formats._
- Pinterest drives 33% more referral traffic to ecommerce sites than Facebook. Pinterest delivers 2x higher ROAS than other digital platforms. [Pinterest Business]
- Snapchat+ subscription revenue reached approximately $500 million annually. [Snap Inc. investor report]
- YouTube is used by 51.6% of marketers primarily for brand awareness, with 43.3% reporting improved product visibility. [HubSpot State of Marketing Report]
With social platforms now central to sales, service, and storytelling, the question is no longer, if your business should be online, but how effectively you’re using it.
Which Platforms Offer the Best Ad Reach and ROI?
YouTube leads with the highest potential ad reach at 2.54 billion users, followed closely by Facebook at 2.28 billion. [Meta official / YouTube Advertising]
Here are the key advertising stats worth knowing:
- Instagram’s ad revenue hit $71 billion by the end of 2025, with Reels between 60–90 seconds driving 24% more shares. [Statista Insta Ads]
- Pinterest delivers 2x higher ROAS than Facebook and Instagram ads and reaches 340 million people via advertising. [Pinterest Business]
- TikTok’s total global ad revenue is projected at $33.1 billion in 2025, up from $23.6 billion in 2024, with a 67% click-through rate on traffic campaigns. [Statista TikTok Ad]
- LinkedIn ads increase purchase intent by 33%, making it ideal for high-value B2B conversions. [LinkedIn Audience]
- Snapchat’s ad reach hit 709 million users, and its advertiser base more than doubled in Q4 2024. [Snap Inc. investor report]
- X (formerly Twitter) is expected to generate $2.26 billion in global ad sales in 2025, marking its first year of ad revenue growth since Elon Musk’s acquisition. [Reuters]
From massive reach to laser-focused B2B targeting, social platforms in 2026 aren’t just ad spaces, they’re business growth ecosystems.
Social media is already moving fast, but what’s coming next will challenge marketers to be sharper, faster, and more data-informed. With audiences fragmenting, AI reshaping creation, and commerce blending directly into content, the next wave is about smarter strategy, not more platforms.
1. Rise of AI-Generated and Creator-Led Content
- 93% of marketers plan to increase or maintain investment in video content, especially short-form and AI-enhanced formats. [HubSpot State of Marketing Report]
- AI tools are reshaping content creation, recommendations, and campaign automation across every major platform.
- The U.S. social commerce market is projected to exceed $150 billion by 2029. [Capital One Shopping Research]
- 67% of social media users say they’ve purchased a product they discovered in a brand’s social media post. [LendingTree Consumer Survey, December 2025]
3. Fragmentation Is Driving Niche Communities
- The average user visits 6.8 platforms monthly, seeking more tailored content experiences. [DataReportal Global Digital Report 2025]
- Emerging platforms like Bluesky and Discord are attracting audiences looking for tighter connections and less algorithmic noise.
4. Messaging Is the New Marketing Channel
- WhatsApp Business and Messenger are seeing increased use in customer care, product discovery, and personalized offers.
- Private, one-on-one interactions are increasingly dominating engagement strategies.
5. ROI, Attribution, and Ad Spend Efficiency Take Center Stage
- As CPMs and CPCs rise, marketers are doubling down on performance analytics, attribution tracking, and channel-specific ROI.
- Ad budgets are shifting from broad reach to high-intent micro-targeting.
Conclusion
The aforementioned social media statistics are more than just numbers, they are signals. They show where your audience is, what they care about, and how they are interacting with brands in 2026. Whether you are planning your next campaign, testing ad formats, or rethinking your posting strategy, this data gives you the clarity to act with confidence.
Managing all these insights effectively requires the right tool. That’s where SocialPilot’s social media management tool fits in, bringing scheduling, analytics, collaboration, and reporting together so you can turn trends and insights into real growth.
So go ahead, turn those stats into strategy and let us help you scale it.