
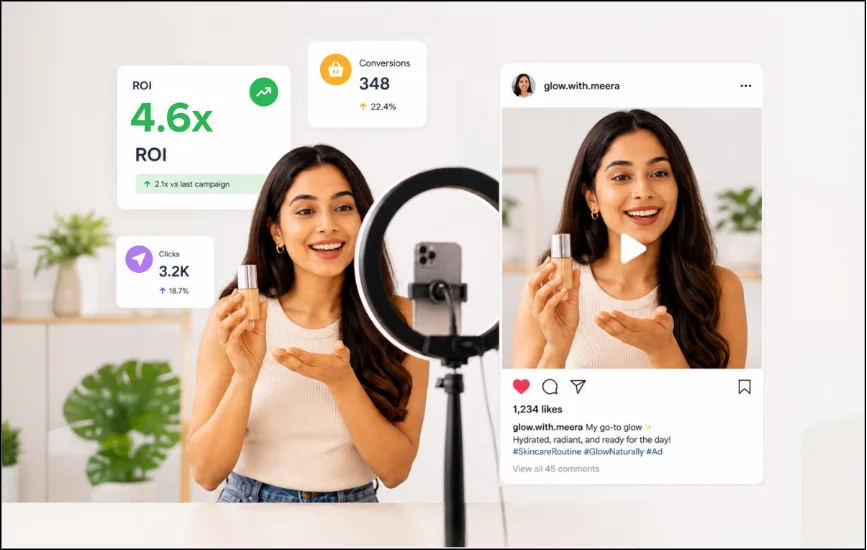
If you have ever tried to justify an influencer budget with a number, you have probably run into the same problem. Search “influencer marketing ROI” and almost every page hands you a confident figure: $5.20 back for every $1, or $6.50, or lately even $6.93. Different numbers, same certainty. None of them tell you where the figure came from, how many campaigns it covers, or what “return” even means.
One marketer asked exactly this in an r/marketing thread:
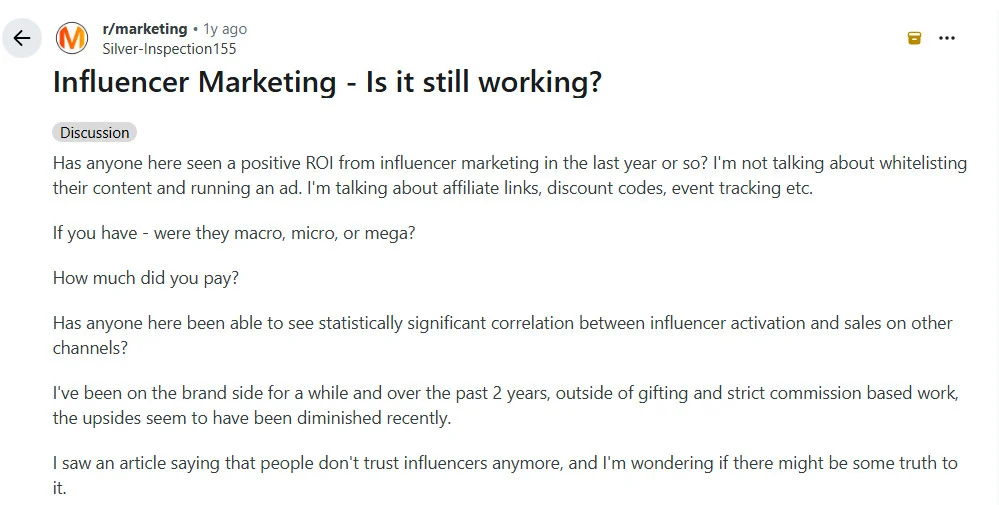
That is the real problem this piece solves. Not “does influencer marketing work.” You are past that. The problem is knowing whether you can trust the number you’re about to put in front of a boss or a client.
Below is what the evidence shows, which measurement methods hold up and which don’t, and how to pick the right one for your budget.
What the Data Actually Shows About Influencer Marketing ROI
The single strongest dataset on influencer ROI is the IPA Effectiveness Databank (2025). Its headline finding is not a big flashy multiple. It is this: influencer marketing pays back slowly, and that is its real strength. Over the long term it returns more than any other channel measured, while over the short term it performs right at the average.

That nuance is the whole story, and it’s the part almost every other guide leaves out. If you only ever judge influencer marketing on its first-month numbers, you are measuring the wrong window.
This section is the diagnostic. Later sections cover how to measure and which tier to pick. If you want the fundamentals first, what influencer marketing involves lays the groundwork.
The Real Benchmarks, Confirmed Across Multiple Sources
The IPA (Institute of Practitioners in Advertising) built its Influencer Databank from 220 campaigns across 144 brands, 36 sectors, and 28 markets, covering more than £133 million in disclosed influencer spending. That scale and that disclosure are what make it trustworthy.
Here is what it found, and the comparison matters more than any single figure.
| ROI window | Influencer marketing | All-channel average | Paid social |
| Short-term ROI Index | 99 | 100 | n/a |
| Long-term ROI Index* | 151 | 100 | 77 |
*The ROI Index isn’t a percentage or a dollar figure. It is scaled so 100 equals the all-channel average. So a short-term 99 is bang on average, and a long-term 151 sits 51% above it.
Read the second row again. Over the long term, influencer marketing scored 151 against paid social’s 77, nearly double. Its long-term ROI multiplier of 3.35x was the highest of any channel the IPA measured, edging out even linear TV. In plain terms, influencer content keeps working long after the campaign goes live.
Now the honest part. The results vary widely from campaign to campaign, with plenty of outliers. And here is the finding most marketers miss. There was no reliable correlation between ROI and how much a brand spent. Spending more did not buy a better return. What moved the needle was the fit between brand and creator, and the quality of the creative itself.
So, the benchmark you can defend is not a dollar figure. It is a pattern. Strong long-term payback, weak short-term payback, high variability, and no shortcut by throwing money at it.
Separating Verified Data from Recycled Claims
Most “influencer ROI” numbers in circulation trace back to a handful of old studies, passed from page to page until they look current. Two you have almost certainly seen:
- “$6.50 for every $1” comes from a 2015 Tomoson survey of 125 marketers reporting what they believed their return was. Never measured campaign data, still recycled as a fresh benchmark.
- “$6.93 per $1,” from a “Nielsen and CreatorIQ 2026” study, has no traceable primary source. It is absent from CreatorIQ’s own State of Creator Marketing report and Nielsen’s newsroom, and appears only on secondary pages citing each other. Don’t use it.
The fix isn’t memorizing which numbers are bad. It’s a quick test you can run on any stat before you cite it:
- Who collected it, and when? A named body with a date beats an anonymous “studies show.”
- Measured or self-reported? Belief surveys and measured campaigns are not the same evidence.
- Is “return” defined? If the page can’t say what counted as return, the number is decoration.
EMV Is Not a Reliable ROI Measurement, and Here’s Why
Earned Media Value (EMV) is the metric most influencer reports lead with, and it is the one most likely to get you in trouble. It is not a revenue figure. It is a reach-and-exposure estimate dressed up to look like one.
That does not make it useless. It makes it easy to misread. Used as a rough gauge of how much attention a campaign earned, EMV is fine. Used as proof that a campaign made money, it falls apart, because it never measured money in the first place.
Keep that line firm in every report you send: EMV tells you how loud a campaign was, not how much it earned.
What EMV Actually Measures (and Doesn’t)
EMV takes the impressions, likes, comments, and shares a piece of influencer content earned, and assigns them a dollar value based on what equivalent paid advertising might have cost. That is the entire mechanism. It converts attention into a hypothetical ad-spend equivalent.
Notice what is missing from that calculation: sales, conversions, sign-ups, revenue, anything that reflects an actual business outcome.
So, a campaign can generate an enormous EMV and drive almost no sales, or a modest EMV and drive a lot. The number moves with visibility, not with results. That is the gap that trips up marketers who report EMV as if it were return.
Why the Industry Itself Calls EMV a Vanity Metric
You do not have to take our word for it. The case against EMV is well documented. Marketing strategist Michael Brito, for one, has catalogued its flaws in detail, and the critique lands on the same three points every time.
First, there is no standard formula. Two platforms can look at the identical campaign and produce wildly different EMV numbers, because each uses its own multipliers. A metric that changes depending on who calculates it is not a benchmark.
Second, it inflates easily. Because EMV rewards raw reach, it flatters big-follower campaigns regardless of whether anyone bought anything. Third, and most important, it is disconnected from revenue by design. It was never built to track conversions.
The practical rule: report EMV only as a directional read on exposure, clearly labeled as such, and never let it stand in for financial return. If a stakeholder needs to know whether the campaign made money, EMV cannot answer the question.
The Real Measurement Hierarchy, From Vanity Metrics to Gold Standard

Not all measurement methods are equal, and the useful thing is to rank them by how close each gets to real causal proof. Once you see them on a ladder, choosing the right one for your campaign becomes obvious.
Here is the hierarchy, from weakest to strongest.
| Method | What it measures | Reliability | Best use |
| EMV | Impressions and engagements valued at ad-equivalent rates | Low, a contested vanity metric with no standard formula | A rough read on exposure only, never proof of revenue |
| UTM / promo-code attribution | Last-click conversions tied to a specific link or code | Medium, real but understates true impact | Day-to-day tracking for any campaign, any size |
| Incrementality / holdout testing | Causal lift versus a true control group | High, the closest thing to real proof | Larger campaigns with the scale to support it |
The jump in reliability as you climb is real. But so is the jump in what each method demands from you. The next sections cover the two that actually measure outcomes.
UTM and Promo-Code Attribution, Useful but Understated
UTM parameters and unique promo codes are the workhorses of influencer measurement. You give each creator a tagged link or a custom code, and every sale that comes through it is directly traceable. It is simple, cheap, and works at any campaign size.
This r/digital_marketing thread walks through the same broken chain.
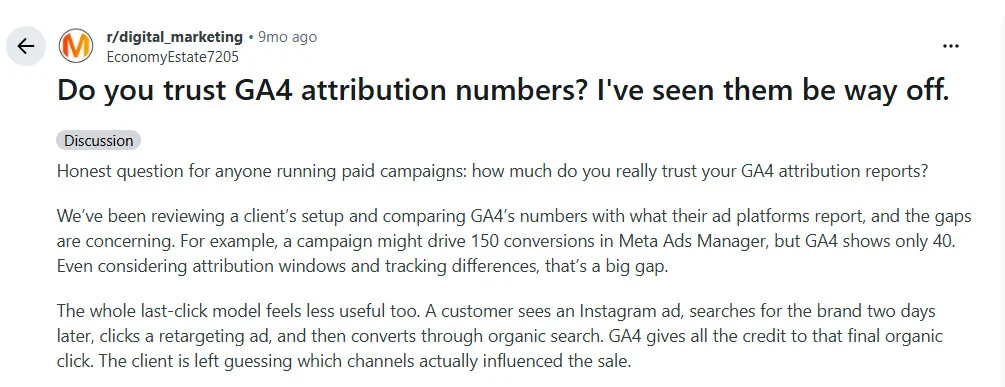
The catch is that it only ever captures last-click behavior. If someone sees an influencer’s post, doesn’t click, and buys a week later through a search, that sale is invisible to the code. The same goes for offline purchases and view-through effects.
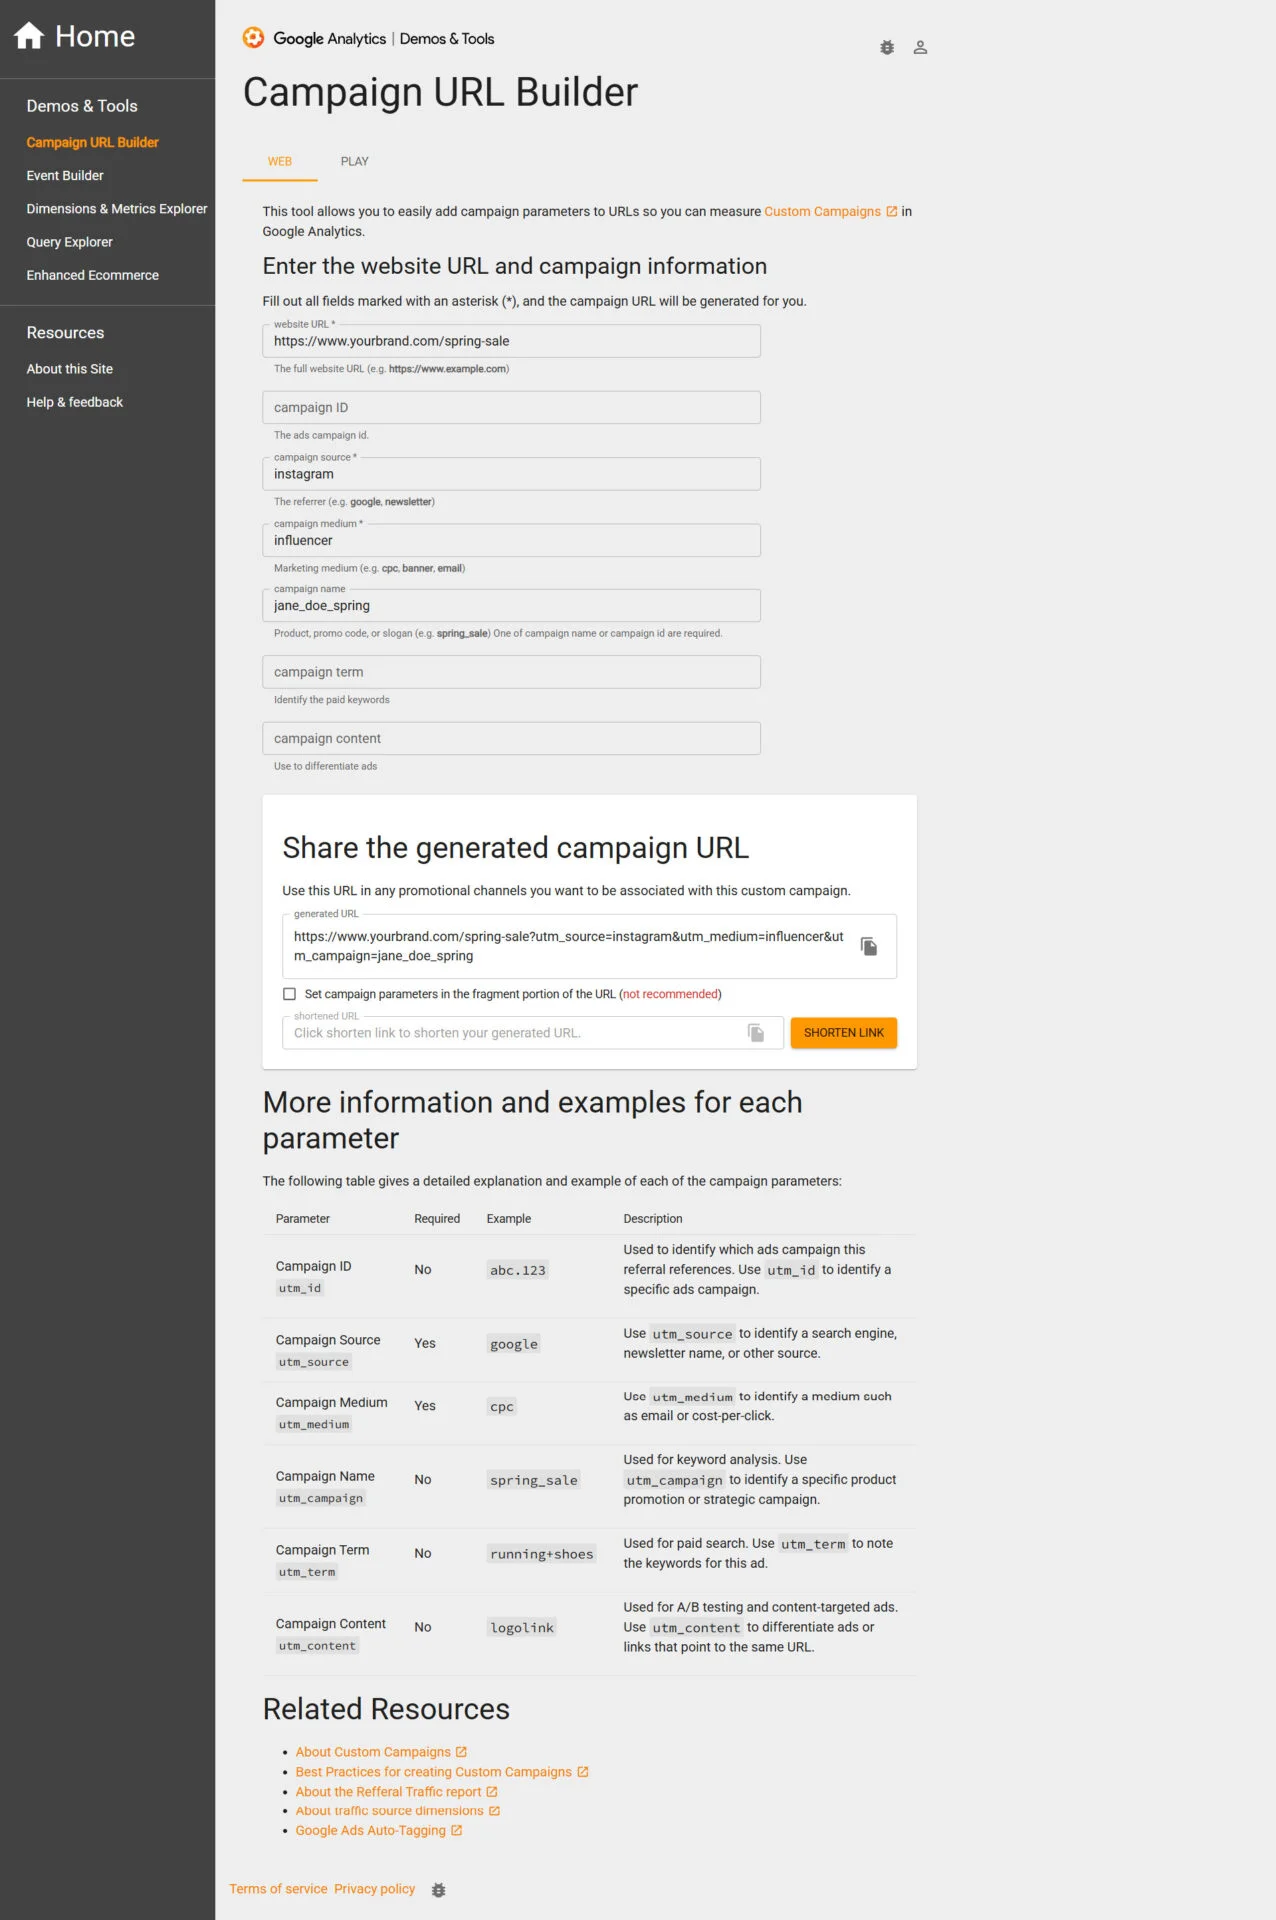
So treat UTM and promo-code numbers as a reliable floor, not a full picture. They tell you the minimum a campaign drove. Real impact, especially the long-term payback the IPA data points to, is almost always higher than the code alone shows.
Incrementality Testing, the Actual Gold Standard
Incrementality testing is the only method on the ladder that answers the real question: what happened because of the campaign that wouldn’t have happened anyway? It works by comparing an exposed group against a matched control group that never saw the campaign, then measuring the difference in behavior.
That control group is the magic. It strips out the sales you would have made regardless, and isolates the lift the campaign actually caused. No other method does that. This is why measurement specialists treat it as the gold standard. It is as close to proof as influencer marketing gets.
The trade-off is cost and complexity. You need the infrastructure to split audiences cleanly and the volume to make the comparison meaningful, which rules it out for small one-off campaigns.
What You Actually Need to Run an Incrementality Test
Incrementality only works at scale, and it is worth being honest about the threshold before you attempt it. As a working rule of thumb, a test needs enough volume for the difference between groups to be statistically real rather than noise: campaigns generating on the order of 10,000 or more weekly impressions, with control and exposed groups of several thousand people each.
Below that scale, the math simply cannot tell a genuine lift apart from random variation. Running a “test” on a tiny campaign produces a number, but not a trustworthy one.
A comment on r/programmatic puts it bluntly:

So incrementality is not a universal answer. It is the right method for larger, ongoing programs, and the wrong one for a single small campaign. If your campaign is small, UTM and promo-code tracking is the honest ceiling of what you can measure, and that is fine.
ROI by Influencer Tier
If there is one place the data agrees on direction, it is this: smaller creators tend to return more per dollar than the big names. Nano and micro-influencers consistently outperform macro and celebrity tiers on ROI across independent sources.
The direction is settled. The exact multiple is not. You should be suspicious of anyone who quotes a precise “nano-influencers deliver X times more” figure as though it were fixed.
Why Smaller Tiers Consistently Outperform on ROI
The clearest evidence comes from a 2024 study in the Journal of Marketing (Beichert and colleagues, “Revenue Generation through Influencer Marketing”), which analyzed more than 1.8 million purchases across three field studies. It found nano-influencers outperformed macro-influencers on revenue per follower, revenue per reach, and return on influencer spend.
A marketer on r/SocialMediaManagers laid out the same math with real quotes:
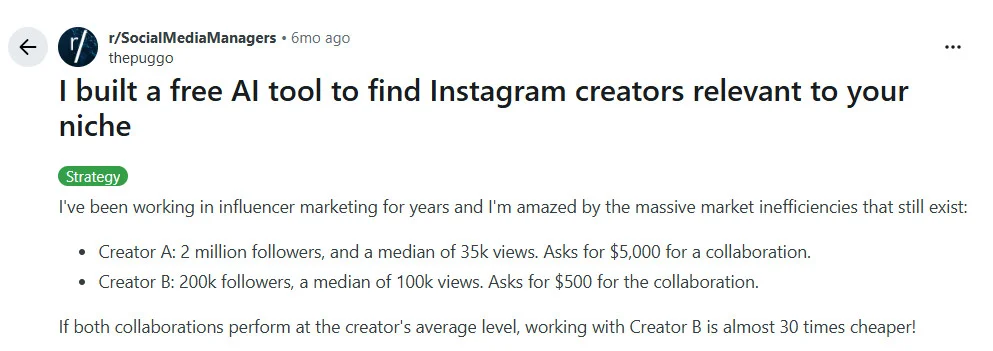
The reason is engagement, not reach. Industry engagement benchmarks consistently show smaller tiers drawing the highest engagement rates. Smaller creators tend to have tighter, more trusting relationships with their audiences, and they speak in a voice their followers recognize as one of their own. That trust converts. A recommendation from someone who feels like a peer carries more weight than the same words from a celebrity.
The IPA’s own finding backs the same logic from a different angle: return did not scale with spend. Bigger budgets and bigger names did not buy better outcomes. Fit and creative did.
What This Means for Budget Allocation
The direction is consistent across the peer-reviewed study above and the IPA’s own variability findings, and it lines up with the engagement benchmarks that favor smaller tiers. But the exact multiples differ so much from source to source that no single number is safe to plan against. Use the direction, not a specific figure.
In practice that means a portfolio of smaller creators is often the more defensible bet than one expensive macro deal, especially if your goal is efficient return rather than sheer awareness. It also means you should test tiers against your own numbers rather than importing someone else’s multiple.
Building an ROI Measurement Plan for Your Own Campaigns
The point of everything above is a decision: which method do you actually use? The answer depends almost entirely on your campaign’s scale, and it is simpler than most guides make it.
You do not need every method. You need the strongest one your scale can support, plus honest tracking from day one.
Choosing the Right Method for Your Scale

Match the method to the volume you are working with, not to what sounds most impressive in a report.
Small or one-off campaigns: UTM links and unique promo codes per creator. Accept that this is a floor, not a full read, and report it that way.
Steady, mid-sized programs: UTM and promo-code tracking as your baseline, with EMV used only as a labeled exposure read, never as revenue.
Large, ongoing programs (roughly 10,000 or more weekly impressions): Layer incrementality testing on top of your attribution tracking to isolate true causal lift.
If you want the full campaign-execution side of this (sourcing creators, pricing, briefs, disclosure), the playbook on running a micro-influencer campaign covers that ground.
What to Track from Day One
Whatever method you land on, set it up before the campaign launches, not after. Retrofitting measurement onto a live campaign is where most ROI numbers go soft.
At a minimum, put unique tracking links or codes on every creator, agree on the conversion window in advance, and record your baseline sales before the campaign starts so you have something to compare against. The right social media tools make this far less manual, but the discipline matters more than the software.
This is also where a reporting tool earns its keep. Pulling every creator’s tagged links, codes, and conversions into one view, instead of stitching spreadsheets together, is what SocialPilot’s analytics and reporting is built for, so the numbers are ready when someone asks for them.
And decide upfront which window you are judging on. Given the IPA’s long-term finding, judging solely on week-one sales will make almost any influencer campaign look weaker than it is.
Trust the Pattern, Not the Number
You started with a number you couldn’t trust. The honest takeaway is that there isn’t one number, there’s a pattern.
Influencer marketing pays back slowly, smaller creators tend to return more per dollar, and no amount of spend shortcuts either fact. Match your measurement method to your scale, judge results over a long enough window, and refuse to cite any figure that can’t tell you where it came from.
The hard part is doing this consistently, campaign after campaign. That is where one place to schedule, track, and report on every creator pays off. See how SocialPilot’s plans fit your workflow.




 Join 55,000+ social media managers


