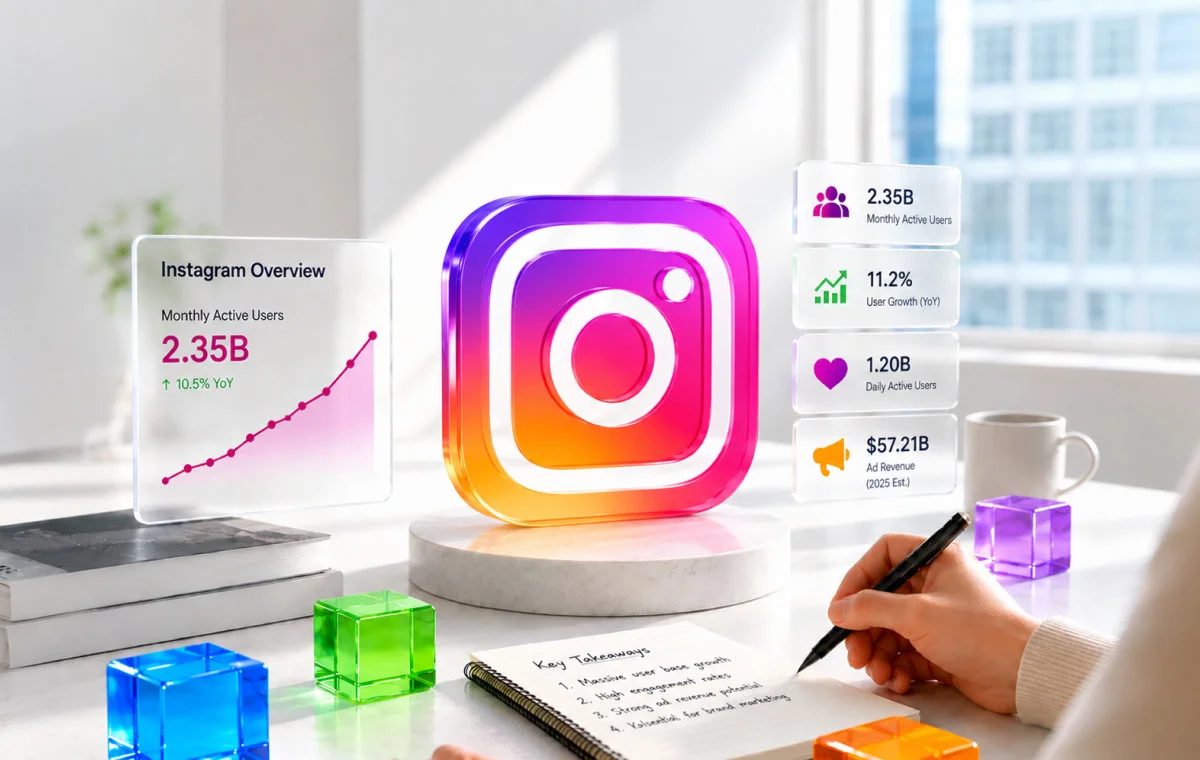
Instagram continues to shape how people discover brands, consume content, and make buying decisions. With over 3 billion monthly active users, rising social commerce activity, and Reels driving more engagement than ever, the platform remains one of the most valuable channels for marketers in 2026. [Meta Q3 2025 Earnings Call]
But succeeding on Instagram today takes more than just posting consistently. From shifting engagement trends and audience demographics to ad performance and creator partnerships, understanding the latest data is key to building smarter strategies.
To help you stay ahead, we've gathered 40+ Instagram statistics for 2026 covering users, engagement, Reels, advertising, shopping, and influencer marketing, so you can make informed, data-driven decisions for your brand.
General Instagram Statistics
1. Instagram has approximately 3 billion monthly active users worldwide, according to Meta CEO Mark Zuckerberg (September 2025), putting it level with WhatsApp and just behind Facebook. Statista estimates 2.99 billion MAU for 2025, confirming the platform's enormous scale despite rising competition from TikTok. [Meta Q3 2025 Earnings Call] [Statista SM users]
2. Instagram reached 2 billion daily active users in Q2 2026. [Meta Q2 2026 Earnings Call]
3. In April 2026, India remained Instagram's biggest market with 513.55 million people reachable by ads, followed by the United States with about 183.3 million and Brazil with roughly 150.7 million. India alone accounts for more than a quarter of Instagram's global ad reach. [DataReportal Digital 2026 Mid-Year Global Update]
4. Meta's Family of Apps daily active people reached 3.60 billion in June 2026, up 3% year-over-year. [Meta Q2 2026 SEC Filing]
5. Instagram is the 5th most-visited site globally (after Google, YouTube, Facebook, and ChatGPT), with 6.55 billion visits in August 2026, an average of 10.22 pages per visit, and a 46.94% bounce rate. These metrics highlight strong on-site engagement despite its largely app-driven user base. [Semrush Instagram Overview]
6. As of September 2026, the top 5 Instagram accounts globally by followers:
| Account | Followers |
| Instagram (official) | ~686 million |
| Cristiano Ronaldo | ~679 million |
| Lionel Messi | ~517 million |
| Selena Gomez | ~403 million |
| Dwayne Johnson (The Rock) | ~381 million |
Instagram Demographic Statistics
7. Globally, Instagram's ad audience is 52.8% male and 46.8% female (April 2026). In the United States, the audience is female-dominant, with 55.1% of users women (August 2026). [DataReportal Digital 2026 Mid-Year Global Update] [Statista US Instagram users]
8. Instagram's global audience is dominated by young adults. As of April 2026, adults aged 25–34 represent the largest group at 34.0%, followed by 18–24 at 27.6%, totaling 61.6% of all users aged 18–34. [Statista Instagram age distribution]
9. According to the 2025 "Americans' Social Media Use" survey by Pew Research, 50% of U.S. adults report using Instagram. [Pew Research Center USA]
Usage by household income:
- Less than $30,000: 41%
- $30,000–$69,999: 46%
- $70,000–$99,999: 54%
- $100,000 or more: 60%
10. Instagram is the most-used social network among US Gen Z, with Instagram (65%), YouTube (63%), and TikTok (58%) leading usage (July 2023–June 2024). [Statista US Gen Z social media usage]
11. According to Pew Research's 2025 survey, 80% of US adults aged 18–29 use Instagram, along with 62% of those aged 30–49, 40% aged 50–64, and 19% of those 65 and older. Instagram remains uniquely strong among younger adults compared to every other social platform except YouTube. [Pew Research Center USA]
12. Across 37 countries in Pew's 2026 survey, a median of 51% of adults use Instagram, rising to 77% among adults aged 18–34. [Pew Research Center SM Users]
Instagram Usage Statistics
13. In 2025, 55% of U.S. teenagers used Instagram daily. About 12% use it almost constantly, 31% several times a day, and 12% about once a day. Overall, 63% of teens use Instagram, and more use it daily than Snapchat or Facebook. [Pew Research Center 2025]
14. In a Q4 2025 survey, 62.2% of Instagram users reported actively following, researching, or evaluating brands and products on the platform. Posting photos and videos (69.8%) and finding funny or entertaining content (68.6%) were the top activities. [DataReportal Digital 2026 Mid-Year Update]
15. Instagram users heavily overlap with other platforms: 76.4% are also YouTube users, 80.0% use Facebook, 79.3% use WhatsApp, and 54.4% use TikTok. [DataReportal Digital 2026 Mid-Year Update]
16. 20% of US adults regularly get news on Instagram. [Pew Research Center Fact Sheet]
17. Instagram's Android app users spend an average of 1 hour 15 minutes per day in the app and open it about 12 times a day (February 2026). US users average 53 minutes daily. [DataReportal Digital 2026 Mid-Year Update]
18. Global time spent on Instagram grew by double digits year-over-year in Q2 2026. [Meta Q2 2026 Earnings Call]
19. 54.6% of internet users aged 16+ used Instagram in the past month, making it the third most-used platform. Excluding China and Russia, that rises to 71.4%, second only to Facebook. [DataReportal Digital 2026 Mid-Year Update]
20. Instagram is the second-favourite social platform among internet users (16.5%), just behind WhatsApp (17.3%). [DataReportal Digital 2026 Mid-Year Update]
Instagram Engagement Statistics
21. Carousels are Instagram's most engaging format, at 0.55% engagement in 2025, ahead of Reels (0.52%) and single images (0.37%). The pattern held in Q2 2026: carousels 0.50%, Reels 0.48%, images 0.33%. [Socialinsider's benchmarks]
22. The median Instagram engagement rate fell from 0.36% in 2024 to 0.30% in 2025, a drop of about 17%, with industry performance varying significantly across sectors. [Rival IQ 2026 Benchmark Report]
23. Rival IQ's Social Media Industry Benchmark Report tracked engagement across industries: Higher Education leads at 1.51%, followed by Sports at 1.10%, while Media achieves just 0.29%. [Rival IQ 2026 Benchmark Report]
24. Brands post a median of 3.69 times per week on Instagram, the lowest posting frequency in six years. [Rival IQ 2026 Benchmark Report]
25. Nano influencers (1K–10K followers) have the highest Instagram engagement rate at 1.73%, followed by micro influencers at 0.68% and mid-tier creators at 0.54%. Macro (0.61%) and mega influencers (0.68%) sit in the same range, highlighting how smaller creators tend to drive stronger audience interaction on Instagram. [HypeAuditor State of Influencer Marketing 2025]
Instagram Business and Advertisement Statistics
26. Instagram's US ad revenue was forecast to hit $32.03 billion in 2025, up 24.4% year-over-year. This represents 50.3% of Meta's total US ad revenue, more than half for the first time. eMarketer later forecast US Instagram ad revenue to pass $42 billion by 2026. [eMarketer Instagram Revenue] [eMarketer Reels]
27. Instagram surpassed Facebook as the #1 US social advertising platform in 2025, the first time in its history, driven by Reels monetization. Instagram now accounts for 50.3% of Meta's US ad revenue, putting it ahead of Facebook for the first time. [eMarketer Paid SM]
28. Instagram ads reached 32.7% of all adults aged 18+ globally in April 2026, equivalent to approximately 1.99 billion potential ad recipients. The ad audience grew by 147 million (+8.0%) in the 12 months to April 2026. [DataReportal Digital 2026 Mid-Year Update]
29. Instagram has the fourth-largest ad audience worldwide after YouTube, Facebook, and TikTok. [DataReportal Digital 2026 Mid-Year Global Update]
30. More than half of shoppers on every social platform spent under $200 in the past year. But Instagram stood out: the share of its shoppers who spent $200 or more was at least 7.6 percentage points higher than on any other platform, and 8.7% spent $700 or more (March 2024 survey). [eMarketer Social Shopping]
31. Instagram is the #1 preferred platform for social shopping among US adults. A September 2025 survey by Power Digital Marketing found that 37.2% would most likely shop via Instagram, ahead of TikTok (30.5%) and Facebook. [eMarketer SM Shopping]
32. About 87% of Gen Z users (ages 16–24) say they've followed a business on Instagram, making the platform a great place to build community and strengthen relationships with both new and existing customers. [Meta for Developers]
33. Instagram is now the most-used platform for brands, at 70%, and 48% of brands rank it among their top three for ROI, ahead of Facebook (42.7%). Among B2B marketers, it ranks first for ROI at 48.4%. [HubSpot 2026 State of Marketing]
34. U.S. influencer marketing spending is projected to reach $10.52 billion in 2025, with Instagram and YouTube attracting over $1 billion more in influencer spending than TikTok. [eMarketer Influencer Spending]
35. The global influencer marketing industry reached $32.55 billion in 2025. Instagram remains the dominant platform, used by 57.1% of brands for influencer campaigns, more than any other social network. [Influencer Marketing Hub]
36. An April 2024 online survey by Forbes Advisor found that 24% of people now use social platforms as their main way to search online (46% of Gen Z), and 44% of Gen Z discover new brands on social media every day. [Forbes Advisor]
Instagram Reels Statistics
37. Every day, over 200 billion Reels are played across Instagram and Facebook, and users reshare them more than 4.5 billion times. [Meta Q4 2024 Earnings Call]
38. Video time spent on Instagram increased 30% year-over-year in Q3 2025, according to Meta's earnings disclosure. Reels specifically now drive 46% of all time spent on Instagram in the US, up from 37% in 2024. [Meta Q3 2025 Earnings Call]
39. 53% of all Instagram ad placements ran on Reels in Q4 2025, up from 35% in Q4 2024, marking Reels as the dominant ad surface on the entire platform. [eMarketer Instagram Reel]
40. Instagram and Facebook Reels combined surpassed a $50 billion annual run rate, Meta confirmed on its Q3 2025 earnings call, making Reels not just a content format but a major revenue engine for Meta. [Meta Q3 2025 Earnings Call]
41. Nearly 10% of the Reels people watch each day are made in Edits, Meta's video editing app, almost tripling in a single quarter. [Meta Q4 2025 Earnings Call]
42. Reels of 30–60 seconds get the highest reach rate, at 5.60% (January–June 2026). [Socialinsider Reels Statistics]
43. Over half of the content recommended in Instagram's Feed is less than a day old, as Meta pushes fresher posts. [Meta Q2 2026 Earnings Call]
How to Turn Instagram Stats into a Smarter Strategy
Instagram statistics reveal what actually drives reach, engagement, and conversions on the platform. From Reels and shopping behavior to influencer performance and ad trends, these insights can help brands focus on what works and build smarter Instagram strategies.
1. Reels are the biggest growth driver
Reels drive 46% of total time spent on Instagram in the US, while accounting for 53% of ad placements, making short-form video the platform's primary discovery engine. Reels of 30–60 seconds earn the highest reach. [eMarketer Reels] [Socialinsider Reel Stats]
2. Engagement is declining, but format still matters
Instagram's median engagement rate dropped from 0.36% in 2024 to 0.30% in 2025, making content quality more important than ever. Carousels now lead engagement (0.55%), just ahead of Reels (0.52%), so they still play a valuable role in storytelling and education, helping brands drive saves, shares, and deeper engagement. [Rival IQ] [Socialinsider Reel Stats]
Instagram officially surpassed Facebook as the largest US social advertising platform in 2025, with a forecast $32 billion in US ad revenue, and forecasts pointing past $42 billion in 2026. For marketers, this signals where paid social investment, especially video-first campaigns, is increasingly concentrated. [eMarketer Reels]
4. Instagram's audience is young, active, and purchase-driven
Nearly 62% of Instagram users are aged 18–34, while 80% of US adults aged 18–29 use the platform. Beyond reach, intent is strong: 62.2% of users actively follow or research brands and products, making Instagram a key platform for discovery and consideration. [Pew Research Center USA]
Instagram is now the top platform for social shopping among US adults, with 37.2% preferring it for purchases. [eMarketer Reels]
6. Smaller creators drive stronger engagement
Influencer engagement drops as follower counts rise. Nano influencers (1K–10K followers) lead with a 1.73% engagement rate, compared to 0.68% for micro creators and around 0.6–0.7% for macro and mega influencers. For brands, smaller creators often deliver stronger trust, engagement, and ROI than mass-reach partnerships. [HypeAuditor]
Next Step for Instagram Growth
Instagram statistics highlight key trends in user behavior, engagement, and content performance that help businesses refine their strategy. By understanding metrics like reach, Reels performance, audience demographics, and engagement patterns, brands can make data-driven decisions to strengthen their presence and drive better results on the platform.
To simplify this process, SocialPilot provides an all-in-one solution to schedule content, track performance, and analyze Instagram metrics in real time. With actionable insights and smart planning tools, businesses can optimize their strategy effectively and turn data into consistent growth.
Start exploring SocialPilot pricing plans and begin your free trial today.