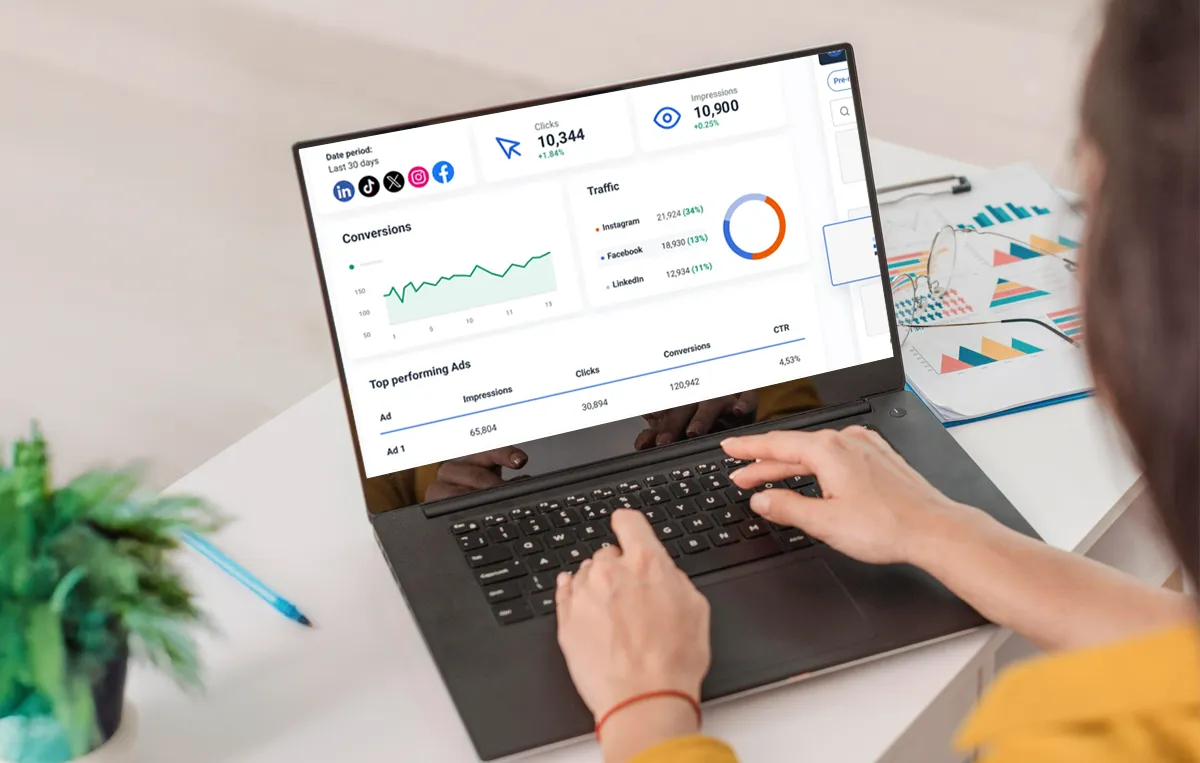

A dedicated analytics or reporting tool closes that gap. The good ones turn scattered platform data into one dashboard, track ROI down to the conversion, benchmark you against your niche, and generate the branded report your client or boss actually reads. That’s the difference between guessing what’s working and knowing.
We tested and compared 12 tools that do this well. Some are all-in-one platforms that publish and analyze in one place. Some are pure analytics and reporting specialists with no publishing at all. This guide sorts them by what you actually need, gives every tool an honest downside, including ours and keeps pricing current.
The Three Types of Analytics Tools You’ll Choose Between
Before you compare features, decide which category you’re shopping in. Native platform dashboards give you a baseline for free, but they stop at a single network and can’t merge data or build reports. Everything past that baseline splits into three groups, and picking the wrong one is how teams end up paying for a tool they only half-use.
All-in-One Management Platforms
These tools schedule, publish, engage, and analyze in one login. Analytics is one module inside a wider platform, so you get performance dashboards, competitor tracking, and white-label reports sitting right next to your content calendar. If you want one subscription to run your whole social operation and one place to prove it worked, this is your category. SocialPilot, Agorapulse, Sprout Social, Buffer, and Planable all live here.
The trade-off: their analytics run deep enough for most brands and agencies, but they rarely match a pure specialist on advanced listening or research-grade benchmarking. For the wider view of what these platforms do beyond reporting, see the full social media tools roundup.
Dedicated Analytics and Reporting Specialists
These tools do one job: measure and report. They don’t publish your posts. What you get instead is depth, deeper benchmarking, richer competitor intelligence, cross-marketing-channel reporting that pulls in SEO and paid, and dashboards built to be exported and sent. Socialinsider, Rival IQ, Agency Analytics, Social Status, Tailwind, Whatagraph, and DashThis all sit here.
The trade-off runs the other way: you’ll still need a separate scheduler to actually post. You’re buying a reporting layer, not a control center.
Where This List Draws the Line
We kept this list to tools built primarily for measuring and reporting on social performance. That means we left out pure social listening suites like Brandwatch and Brand24 (great for sentiment and monitoring, not for performance reporting), general business-intelligence platforms like Power BI and Looker Studio (powerful, but you have to build every social report yourself), and native-only dashboards. Native analytics belong in your workflow as a free baseline, they’re just not enough on their own, which is why you’re here.
Five Things a Dedicated Tool Does That Native Analytics Can’t
If native dashboards already tell you your likes and follower count, what does a paid tool actually add? Five things, and each one maps to a decision you’re trying to make.
- Data-driven decisions instead of guesswork. Native analytics tell you what happened. A dedicated tool tells you what to do about it, which post format, posting time, and topic consistently outperform, so you stop testing blind and start doubling down on what works.
- A real picture of your audience. Demographics, interests, and behavior across platforms come together in one view, so you can write for the people actually engaging rather than the audience you assumed you had. Deeper audience understanding is what turns reach into loyalty.
- ROI you can actually trace. By connecting to Google Analytics, Looker Studio, or your CRM, the right tool ties conversions and revenue back to specific campaigns and posts. That’s how “social is busy” becomes “social drove this much pipeline” the sentence that keeps the budget.
- Competitive benchmarking. Native tools can’t see over the fence. A dedicated tool shows how you stack up against direct competitors and industry averages, exposing the content gaps and openings you’d never spot looking only at your own numbers.
- Reporting that saves hours. Automated dashboards and scheduled, branded reports replace the monthly spreadsheet grind. Agencies and teams share live access instead of rebuilding a deck every month, the single biggest time save most buyers report.
Quick Comparison of the All-in-One Platforms at a Glance
Here’s how the five all-in-one platforms compare on deep feature matrix’s. Prices are the entry paid tier billed annually and should be re-verified against each vendor’s live page before you buy.
Note where each one has a genuine gap; no tool wins every row.
| SocialPilot | Agorapulse | Sprout Social | Buffer | Planable | |
| Am besten für | Agencies, SMBs, multi-location brands | Agencies, eCommerce, social-first brands | Large businesses and enterprises | Creators, solopreneurs, mid-stage startups | Agencies, marketing teams, social managers |
| Startpreis | $30/mo | $99/mo | $199/mo | $6/mo/channel | $33/month Add on $12/mo |
| Detailed cross-platform analytics |  |
|
|
|
|
| In-depth engagement tracking | |
|
|
|
|
| Inhaltliche Leistungsanalyse | |
|
|
|
|
| Customizable dashboard views | |
|
|
|
|
| Audience / follower insights | |
|
|
|
|
| Analyse der Wettbewerber | |
|
|
 |
(newer) |
| Identifizierung von Beeinflussern | |
|
|
|
|
| AI insights generation | |
|
|
|
|
| Soziales Zuhören | |
|
Add-on | |
|
| White-label / branded reports | |
|
|
|
|
| Auto-scheduled report delivery | |
|
|
|
|
| Multi-format export (PDF/CSV) | |
|
|
|
|
| Customer support | 24/5 live chat | Delayed responses reported | Priority (paid tiers) | Email / chat | In-app chat |
All-in-One Management Platforms with Built-In Analytics
These five tools handle your whole social workflow, planning, publishing, engagement, and analytics under one login. For most agencies, SMBs, and in-house teams, this is the practical choice: the reporting is deep enough to satisfy a client, and you’re not paying for or logging into a second tool just to see the numbers.
Full
Partial or add-on
Nicht verfügbar
The six dimensions are cross-platform analytics, competitor benchmarking, custom/white-label reporting, social listening, multi-account support, and built-in publishing.
The full-suite pick that puts client-ready reporting first.
Coverage
- Analytik
- Benchmarking
- Berichterstattung
- Listening
- Multi-account
- Veröffentlichung
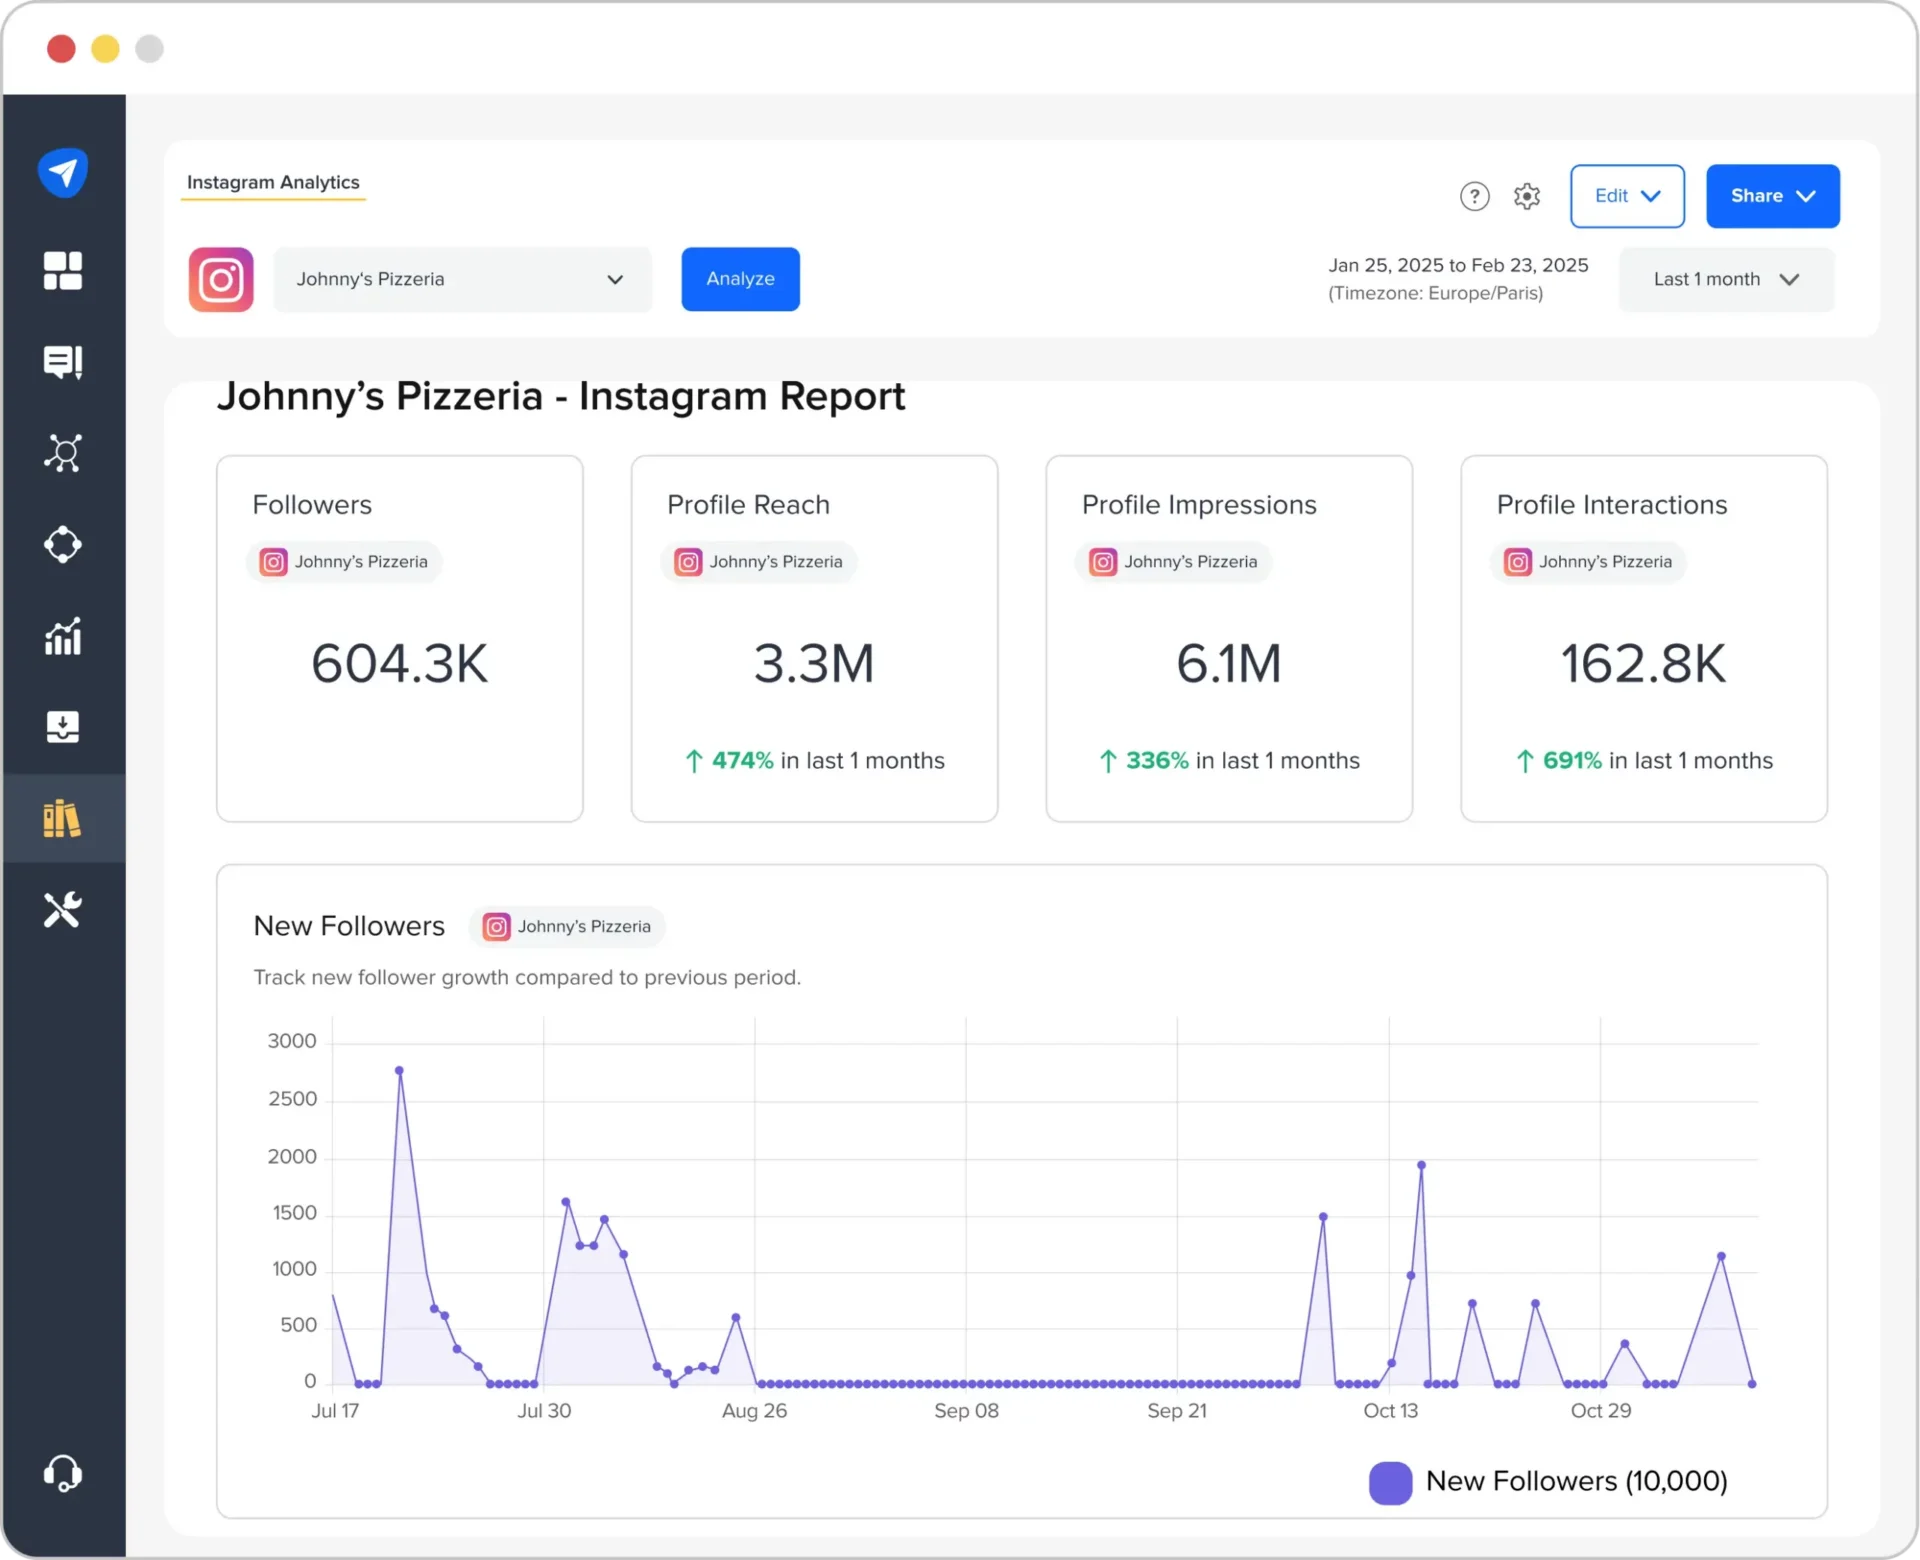
What it actually looks like: SocialPilot opens on a single dashboard showing engagement rate, audience growth, and content reach across every connected channel in real time. The reporting layer is where it goes deeper than most all-in-one tools: a custom report builder where you add and resize pages and metric blocks, reusable templates, one-click competitor analysis, and white-labeling that puts your own colors, fonts, and logo on the export. Reports can be scheduled to send automatically on a set date, so a client gets their numbers on the first of the month without you touching it.
SocialPilot’s edge is putting agency-grade reporting inside the same tool you publish from, so a fashion client’s report can lead with Instagram reach while a B2B client’s leads with LinkedIn engagement. The trade is depth on the research side: it reports on the accounts you manage rather than researching accounts you don’t. See SocialPilot’s own analytics and reporting features and, for branded client work, our custom report builder.
| Ultimate | Premium | Standard | Essentials |
$170.00/Monat$200
Jährliche Abrechnung (15% sparen)
|
$85.00/Monat$100
Jährliche Abrechnung (15% sparen)
|
$42.50/Monat$50
Jährliche Abrechnung (15% sparen)
|
$25.50/Monat$30
Jährliche Abrechnung (15% sparen)
|
|
Social-Media-Management optimieren
|
|||
SocialPilot’s paid plans start at $30/month on the Essentials tier and scale through Standard, Premium, and Ultimate for larger agencies, with a 14-day free trial and no card required.
What running SocialPilot standalone requires: very little on the management side, it publishes, engages, and reports in one place. The gap is listening: for brand-mention monitoring and sentiment you’d add a tool like Brand24, and there’s no influencer discovery or AI-written insight summaries, so those stay manual or move to a specialist.
The all-in-one that ties social straight to revenue.
Coverage
- Analytik
- Benchmarking
- Berichterstattung
- Listening
- Multi-account
- Veröffentlichung
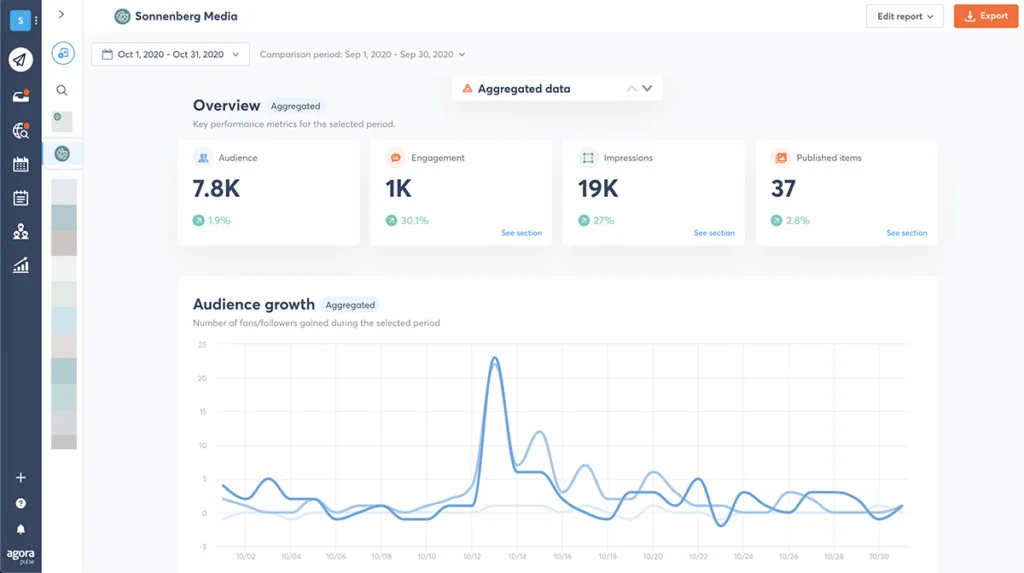
What it actually looks like: Agorapulse puts organic and paid analytics on one dashboard, tracking Facebook and Instagram ad performance next to your organic reach, with reports that highlight top content, team performance, and engagement trends. Two newer modules matter: Competitor Listening measures Share of Voice across Facebook, Instagram, X, YouTube, Reddit, and the web with sentiment tracked over time, and Report Studio adds a drag-and-drop report builder with branded PDF export.
Where Agorapulse earns its keep is the last mile of ROI. Because it pulls conversion data from Google Analytics into the same dashboard as your organic and paid social, an eCommerce team can see that an Instagram campaign didn’t just get 40,000 impressions, it drove a measurable number of sales. That connection is why brands willing to pay more choose it over lighter tools.
Agorapulse pricing starts at $99/month per user on the Standard plan (around 10 profiles) and climbs to roughly $149/month and $199/month tiers, with a 30-day free trial.
What running Agorapulse standalone requires: not much on coverage, it does all six jobs. The friction is cost and onboarding: the learning curve is real for first-timers, and if X (Twitter) is central to your strategy you’ll pay extra for its analytics on top of your plan.
The analytics and listening heavyweight of the full-suite field.
Coverage
- Analytik
- Benchmarking
- Berichterstattung
- Listening
- Multi-account
- Veröffentlichung
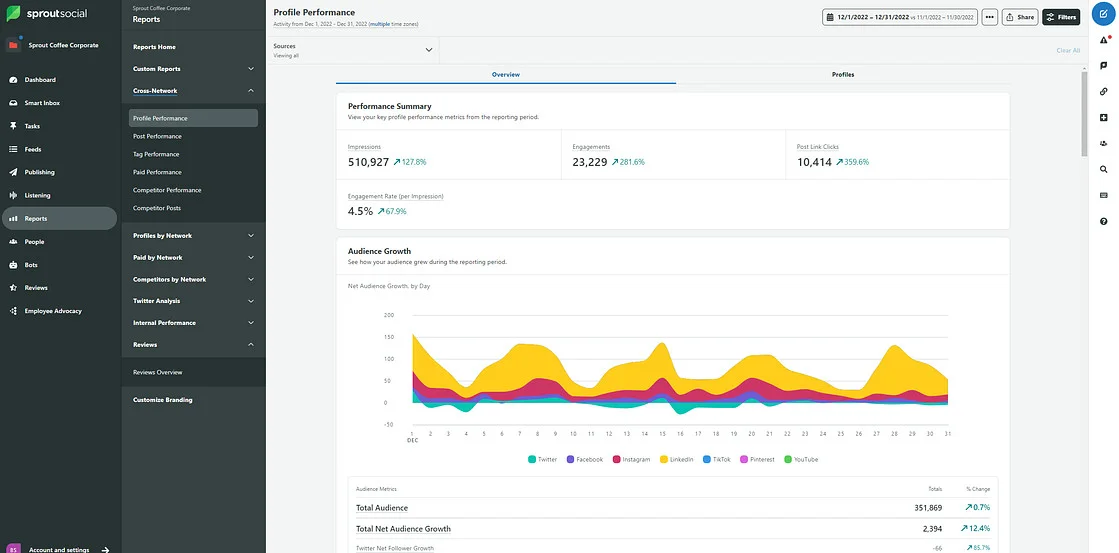
What it actually looks like: Sprout Social tool overall feels heavy for new users, but the reporting dashboard is cleanly organized, open it and content performance, competitive analysis, and customer-care team performance are already segregated. A cross-channel dashboard compares platforms on core engagement metrics, and the tag performance report is a standout: group posts and inbound/outbound messages under a tag to see how a whole campaign performed in one view. The customer-care analytics are the real differentiator; if your social team also handles support, you measure response times, resolution rates, and workload the same way you measure post performance.
Sprout has the deepest analytics here and genuinely strong native listening, which is why enterprises pick it. The trade is cost and rigidity: everything is priced per seat, so teams scale expensively, and full listening and sentiment sit behind the top tier.
Sprout Social’s main plans start at $199/seat/month for Standard, followed by Professional at $299 and Advanced at $399 per seat/month. Enterprise pricing is available by custom quote.
What running Sprout standalone requires: very little on coverage, since it does everything to some degree and handles listening in-house on the top tier. The real question is whether the per-seat bill fits your headcount, since costs scale with every user you add.
The simplest analytics dashboard for creators and small teams.
Coverage
- Analytik
- Benchmarking
- Berichterstattung
- Listening
- Multi-account
- Veröffentlichung
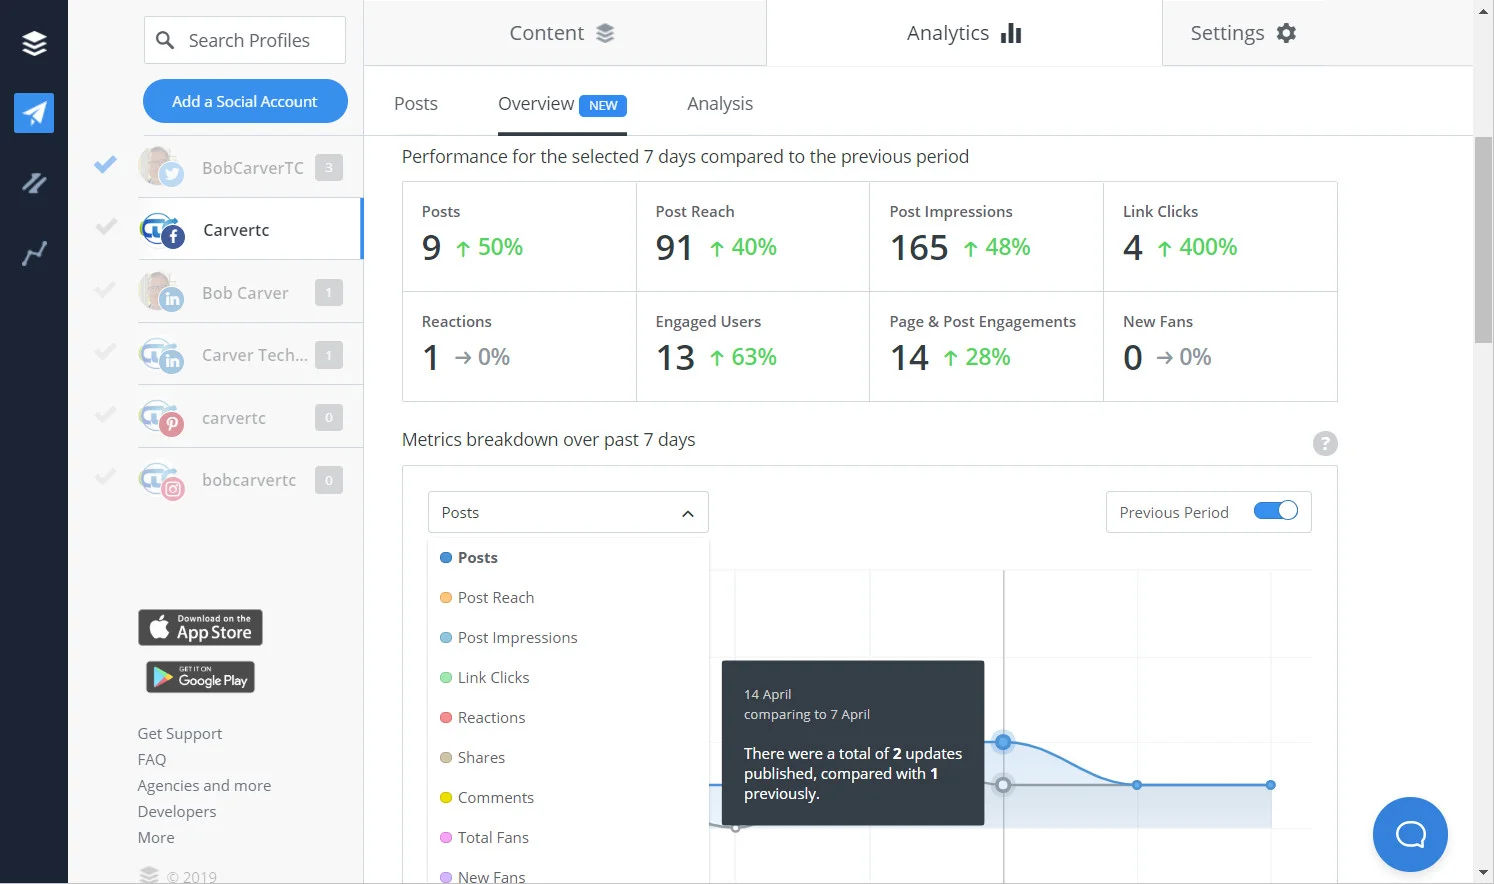
What it actually looks like: Buffer's rebuilt analytics, now branded Insights and positioned as free, actionable analytics included across plan tiers, cut past vanity metrics to engagement rate, impressions, reach, clicks, and follower growth. Everything breaks down by post type (video, image, carousel), and you filter by date range for a specific campaign. Custom reporting and tag performance are there for teams that outgrow the basics, but the whole design is built around reading it in seconds.
The appeal is speed to insight. A solo creator can open Insights, see that carousels are outperforming single images two-to-one this month, and adjust next week’s plan in under five minutes. That simplicity is the point, and it’s why Buffer keeps winning with creators even as heavier tools pile on features.
Buffer’s paid plans start at $6/month per channel (about $5 billed annually) on the Essentials plan, on top of a free plan covering up to three connected channels; additional channels bill at the base rate.
What running Buffer standalone requires: a second tool once you outgrow it. Cross-account analytics beyond four channels, competitor benchmarking, and TikTok analytics all live outside Buffer, so omnichannel brands pull those elsewhere.
Content collaboration with analytics living in the same window.
Coverage
- Analytik
- Benchmarking
- Berichterstattung
- Listening
- Multi-account
- Veröffentlichung
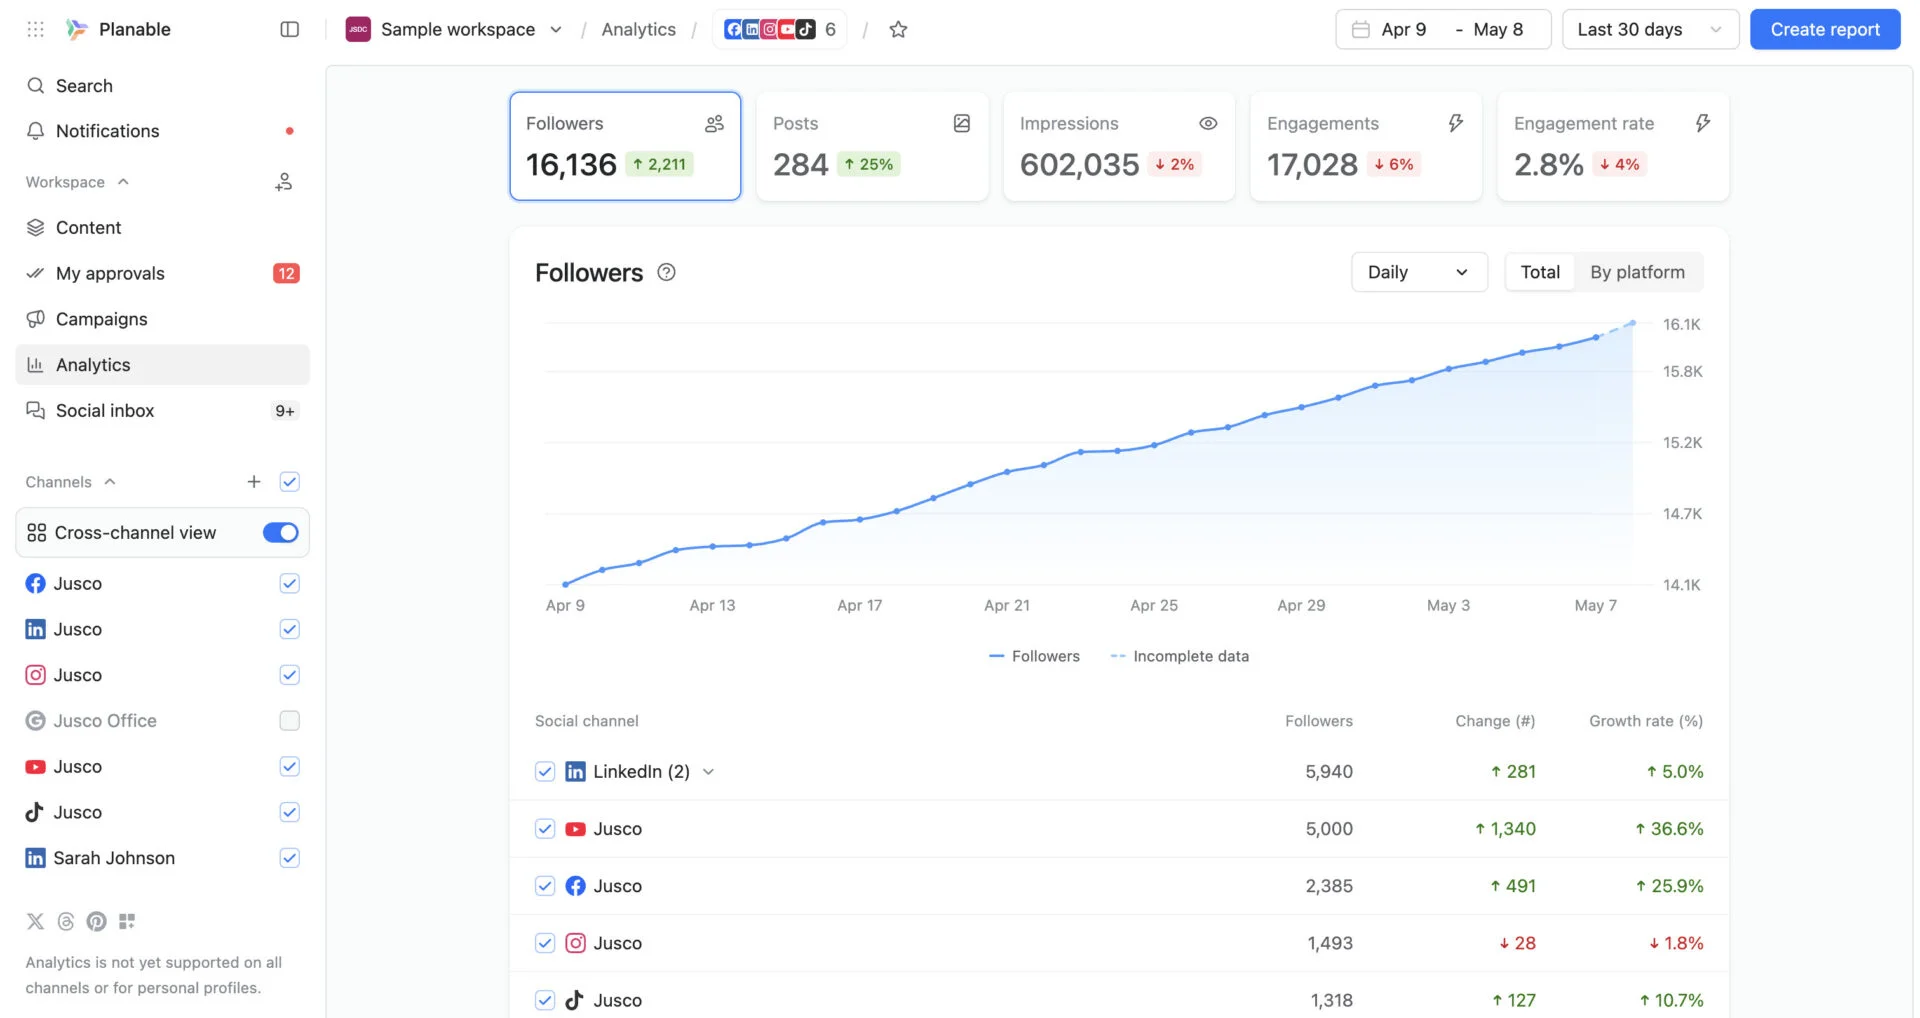
What it actually looks like: Planable is a sleek, content-first workspace where feedback, approvals, and analytics share the same view. Assign post labels by content type or campaign, then track how each category performs and adjusts strategy on the fly. You get at-a-glance metrics (followers, impressions, engagement, page visits), one-click post-level drill-downs, audience demographics down to job function and seniority, and clean branded reports in a few clicks.
Because approvals, comments, and analytics all live in one place, a small agency moves from “here’s the draft” to “here’s how last month’s campaign performed” without switching tools or exporting anything. For content-first teams that value collaboration as much as measurement, that single workspace is the draw.
Planable’s analytics pricing is a $12/month-per-workspace add-on for analytics feature (after a 7-day trial), layered on any paid plan, which start at $33/month.
What running Planable standalone requires: a listening tool if you need brand monitoring. Planable now covers competitor benchmarking (up to five competitors across five networks), so that old gap is closed, but it still doesn’t track mentions, keywords, or sentiment across the web.
Dedicated Analytics and Reporting Specialists
These seven tools don’t publish your posts, they measure and report, and they do it deeper than any all-in-one module. Reach for one when analytics is the job itself: research-grade benchmarking, multi-channel reporting that folds in SEO and paid, or client dashboards that need to look flawless. Just remember you’ll run a separate scheduler alongside them.
The benchmarking specialist with AI content-pillar clustering.
Coverage
- Analytik
- Benchmarking
- Berichterstattung
- Listening
- Multi-account
- Veröffentlichung
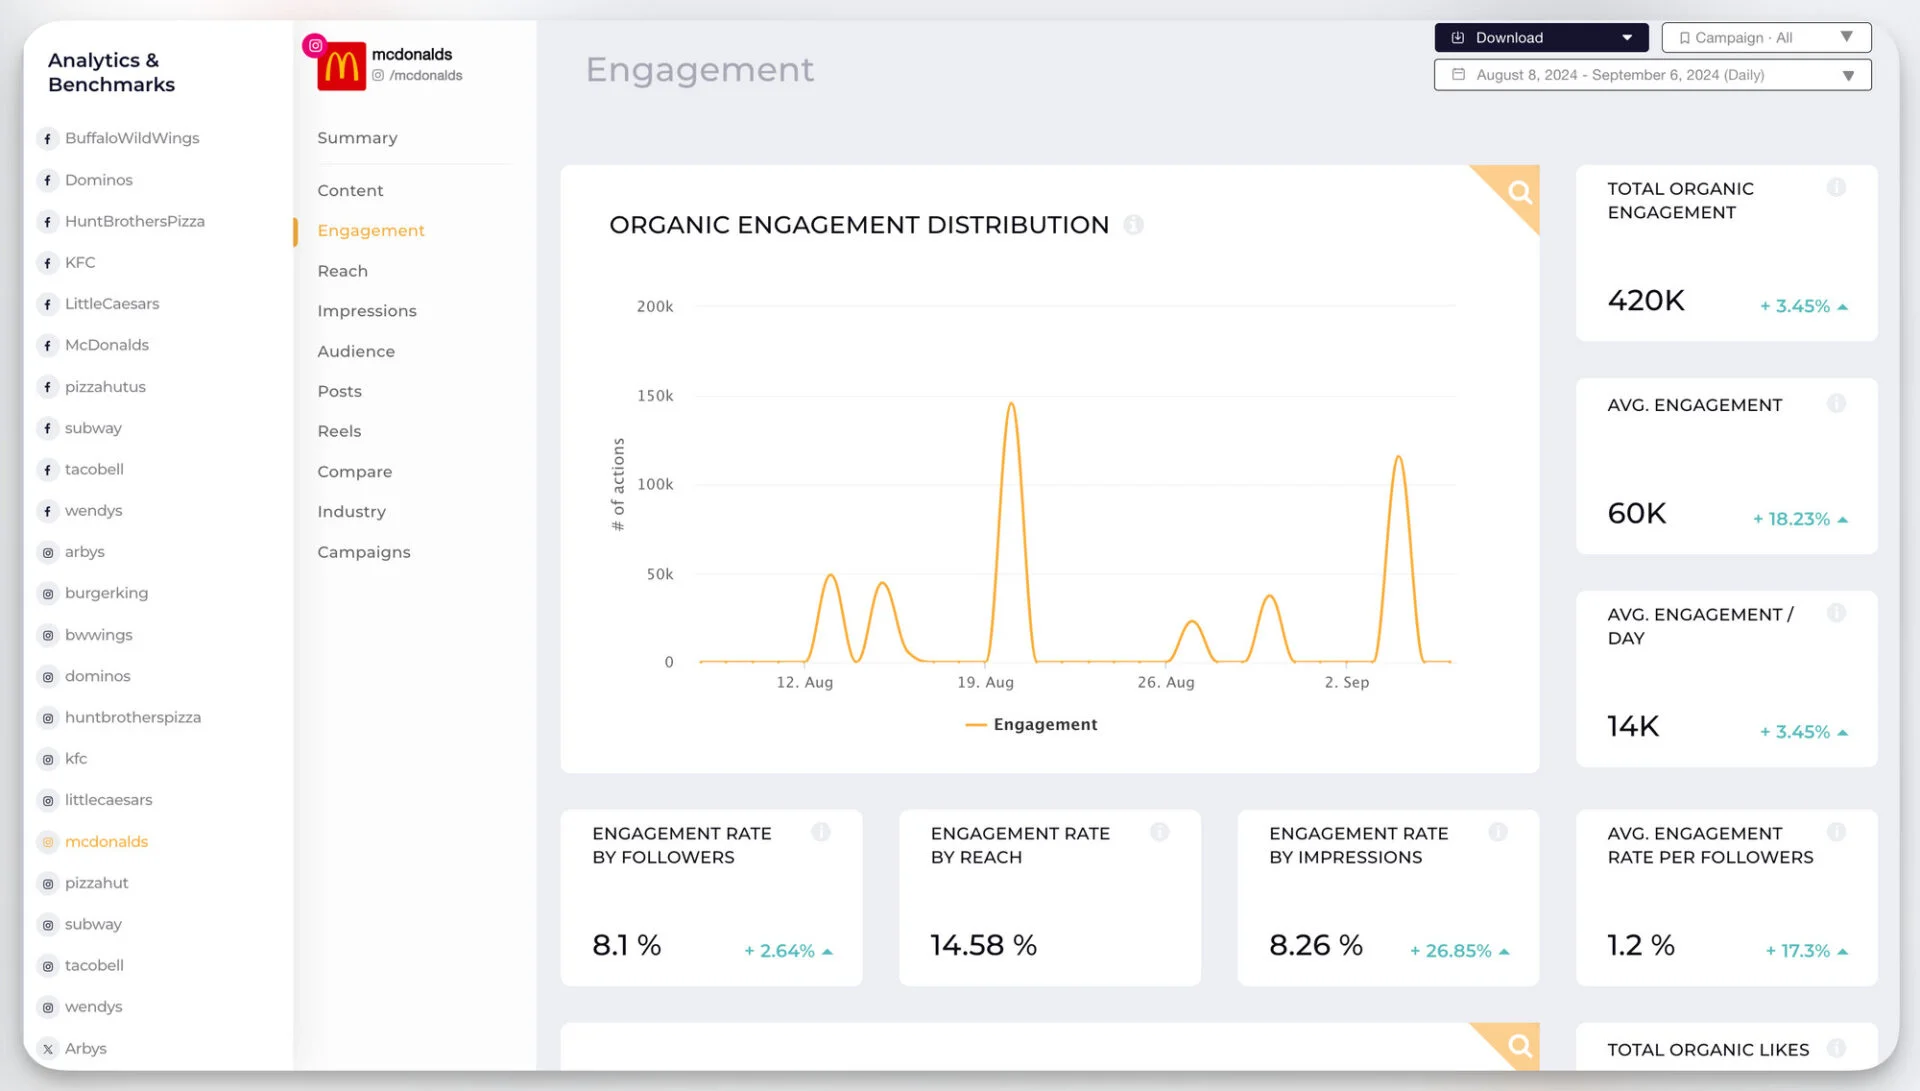
What it actually looks like: Socialinsider’s competitive analysis is one of its strongest features, track how your brand stacks up against direct and indirect competitors across channels. The standout is AI-powered content pillar insights: it automatically clusters your posts by theme with no manual tagging, so you see how all your “behind-the-scenes” content performs against your “educational” or “promotional” posts across platforms. The same clustering reveals which of a competitor’s content pillars are working and worth borrowing.
For a brand strategist, that clustering is the difference between a report that says “engagement is up 8%” and one that says “your educational posts drive three times the saves of your promotional ones, and your top competitor has shifted 60% of their content to that same pillar.” That’s a strategy meeting, not a status update.
Socialinsider plans starts at $99/month/member for 20 profiles, scaling to $149 (30 profiles) and $239 (40 profiles), with a custom enterprise tier and a 14-day free trial on all plans.
What running Socialinsider standalone requires: a scheduler, since it doesn’t publish, plus setup patience and budget. The price and profile counts point at agencies and enterprises; smaller operators won’t need the volume of data it provides.
Competitor intelligence with native listening built in.
Coverage
- Analytik
- Benchmarking
- Berichterstattung
- Listening
- Multi-account
- Veröffentlichung
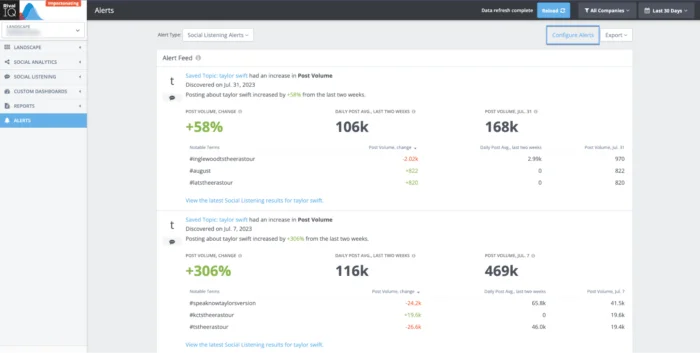
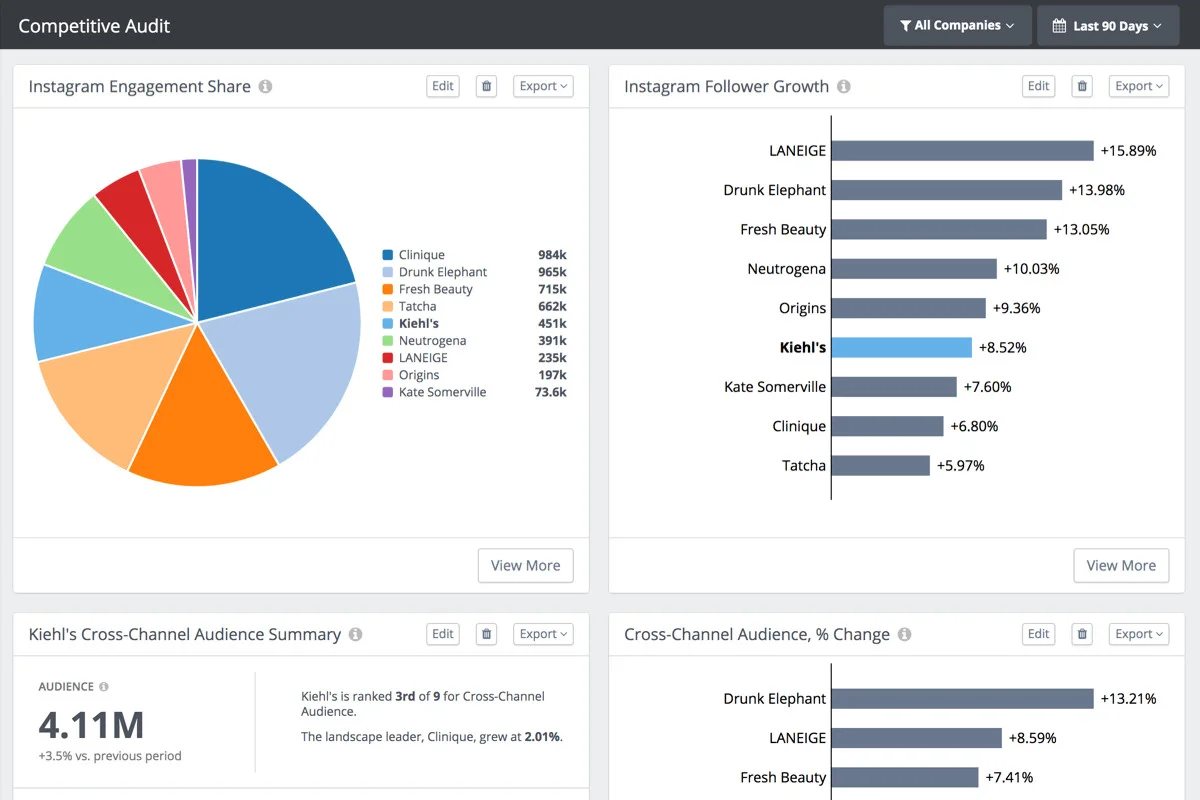
What it actually looks like: Rival IQ is built around competitor intelligence, social tracking, benchmarking, custom reports, influencer tracking, and paid/organic insights. Crucially, it has social listening baked in, which Socialinsider lacks, so you get monitoring and benchmarking in one tool. Its competitor view compares your metrics against rivals across channels, down to social bios and niche benchmarks, and it holds a live leaderboard of who’s winning which platform.
Where it pulls ahead is the sheer number of competitors you can watch at once. A large team tracking a dozen rivals across every channel turns a quarterly competitive audit into something you glance at weekly.
Rival IQ pricing starts at $239/month to monitor 10 companies, climbing to $349 (20 companies) and $559 (40 companies), after a 14-day free trial.
What running Rival IQ standalone requires: a scheduler alongside it, and a higher tier to unlock X (Twitter) analytics, social listening, and custom-branded exports, the entry plan is thin on those for a small agency’s budget.
One client dashboard for social, SEO, and paid.
Coverage
- Analytik
- Benchmarking
- Berichterstattung
- Listening
- Multi-account
- Veröffentlichung
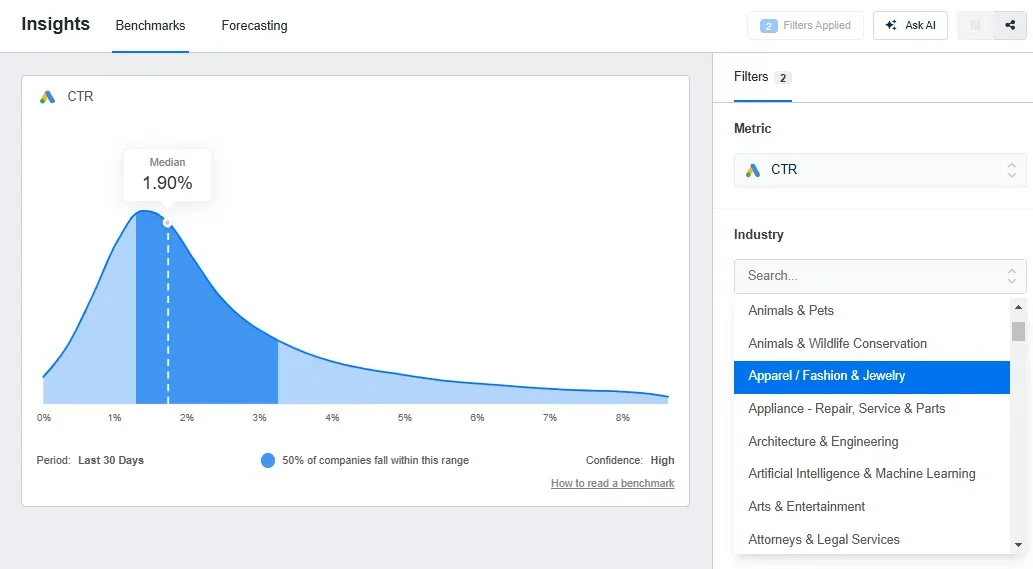
What it actually looks like: Agency Analytics gives agencies a client reporting dashboard that pulls data together into automated, customizable reports and it goes well beyond social, with SEO, PPC, and website analytics in the same view. A competitor feed shows how each of your rivals’ posts is performing, reports are drag-and-drop and visually clean, and you can compare against industry benchmarks, set goals with visual progress bars, apply white-label branding, and give clients 24/7 access to live dashboards.
The reason agencies pick it over a social-only tool is the single-dashboard story it tells a client: one login showing social growth, SEO rankings, and paid performance side by side proves the whole retainer at once, not three separate line items.
Agency Analytics now runs on a single plan priced per client $25 per client/month (about $20/month when billed monthly) with unlimited data sources, reports, and staff and client users included, plus custom enterprise pricing for agencies with 25+ clients.
What running Agency Analytics standalone requires: a publishing tool, since it only reports. The price can feel steep for social-only teams, but the SEO/PPC/social consolidation is the point if you sell more than social.
Deep Meta-ads reporting for brands and agencies.
Coverage
- Analytik
- Benchmarking
- Berichterstattung
- Listening
- Multi-account
- Veröffentlichung
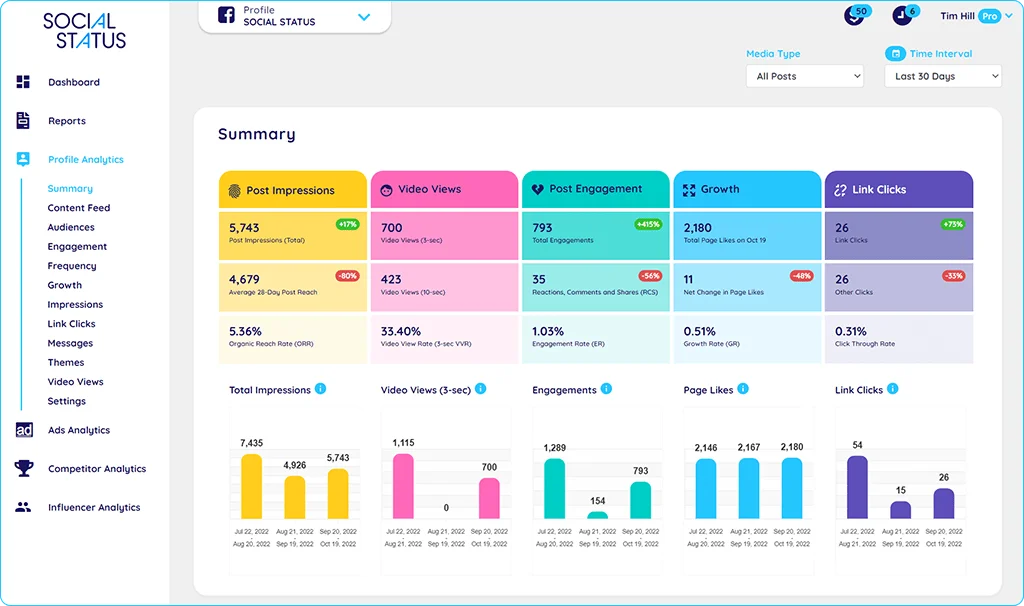
What it actually looks like: Social Status is laser-focused on analytics, with separate tabs for ads analytics, competitor analysis, and influencer analytics. Its ad analytics consolidate all your Facebook Ads Manager data in one place, it supports all 14 Facebook ad objectives and five placements, including Facebook Feed, Instagram Feed, Instagram Stories, Messenger, and Audience Network. Reporting is flexible: export in CSV, XLSX, PDF, PPTX, and Google Slides, and build automated multi-channel reports that aggregate organic, campaign, and paid activity.
For a team running heavy Meta ad spend, that objective-and-placement depth is the whole reason to buy. You can see which placement, Stories versus Feed versus Audience Network is quietly eating budget without returning, then reallocate. Most all-in-one tools flatten paid data; Social Status keeps every objective and placement separate so the waste is visible.
Social Status offers a free plan, then small-business tiers at $9, $29, and $49/month, and professional tiers from $99 up to $1,499/month for high-volume agencies.
What running Social Status standalone requires: a scheduler, since it’s analytics-only. It’s excellent for SMBs on Meta ads, but influencer analytics are limited and there’s no social listening, so large agencies may find it thin.
The Pinterest-and-Instagram analytics specialist.
Coverage
- Analytik
- Benchmarking
- Berichterstattung
- Listening
- Multi-account
- Veröffentlichung
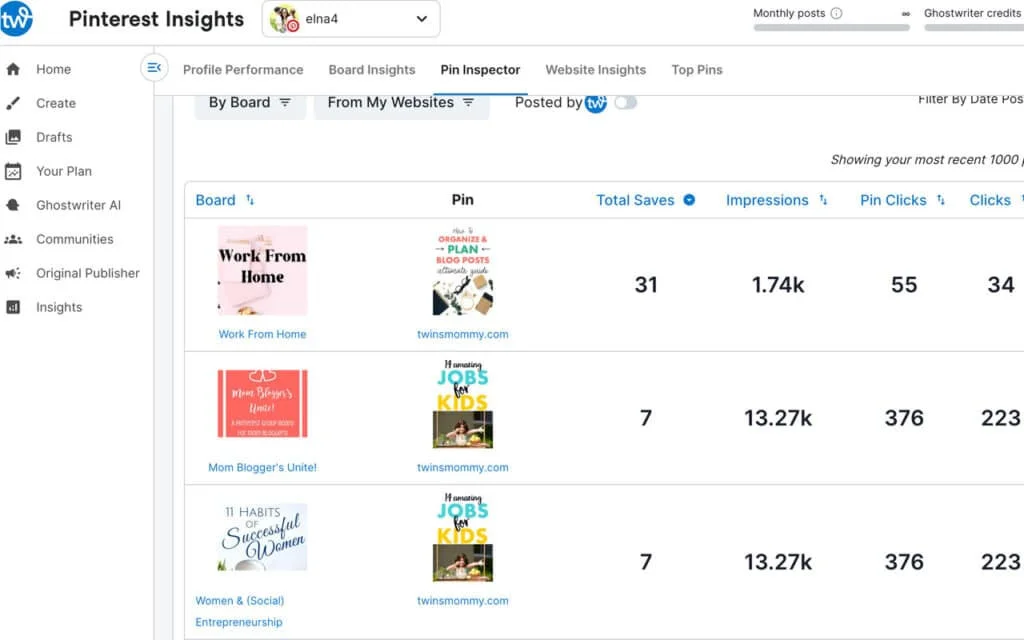
What it actually looks like: Tailwind is a simple analytics-and-scheduling platform built for Pinterest-and-Instagram-first businesses. It offers a genuine deep dive into Pinterest boards and, through its Google Analytics integration, shows the full picture of the traffic Pinterest sends to your site, total saves, impressions, pin clicks, and pin count. For Instagram, it surfaces metrics you don’t get natively, like reaction score, engagement score, and engagement rate, all with week-over-week benchmarking.
For an eCommerce store that treats Pinterest as a traffic channel, this is the rare tool that connects a pin to an actual site visit. You see which boards and pins send real traffic, then create more of what converts, clarity the native app doesn’t offer.
Tailwind pricing starts with Pro plan at $29.99/month (1 account, 1 user), Advanced $54.99/month (2 accounts, 2 users), and Max $99.99/month (3 accounts).
What running Tailwind standalone requires: another tool the moment you go beyond Pinterest and Instagram. It’s narrow by design and not built for omnichannel presence or large-scale benchmarking.
AI-drafted cross-channel reports for agencies.
Coverage
- Analytik
- Benchmarking
- Berichterstattung
- Listening
- Multi-account
- Veröffentlichung
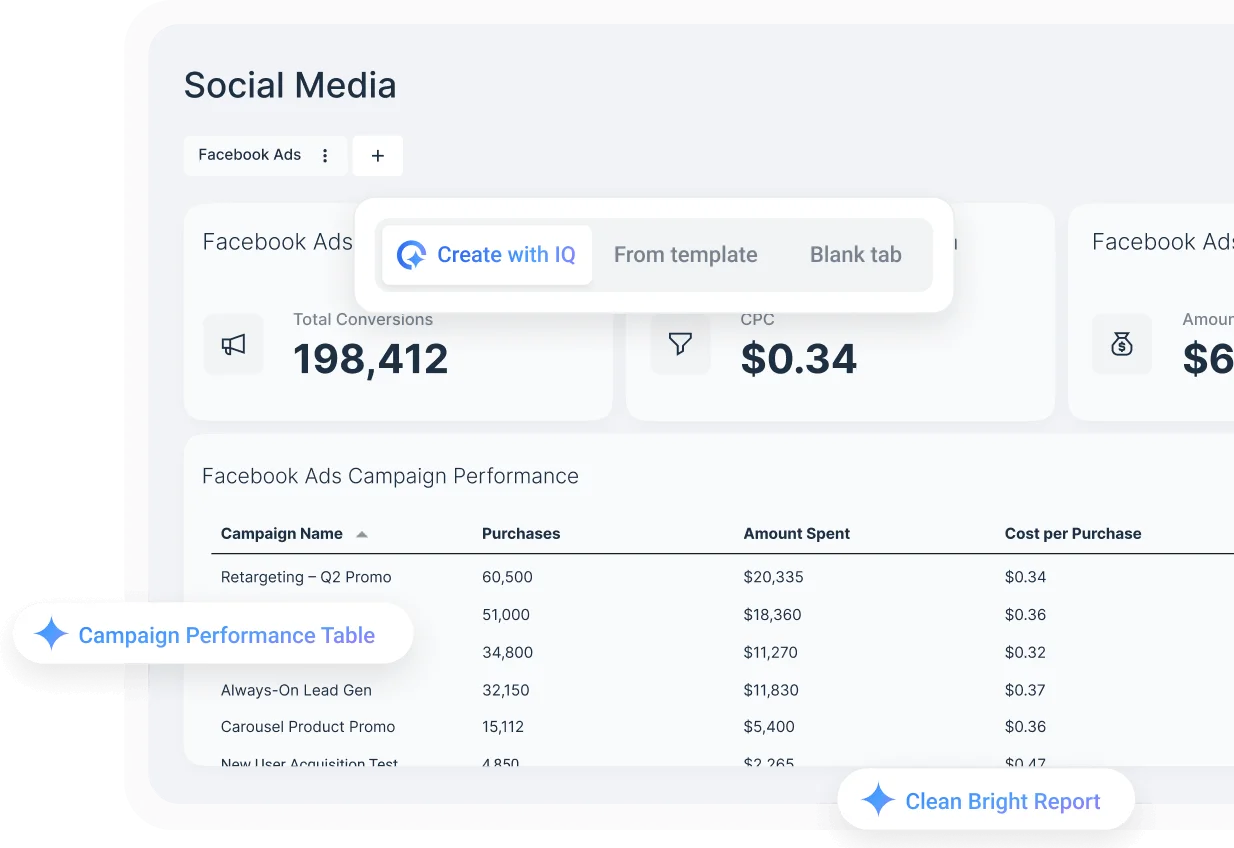
What it actually looks like: Whatagraph supports every major social platform and pulls cross-channel data, SEO, PPC, and more into one hub. Its AI-powered report creation is the highlight: prompt the Whatagraph IQ feature to build reports, brand them from a single uploaded image, and explain performance data in plain language, all in one click.
The plain-language layer is what makes it stick in agencies. Instead of a junior analyst spending an afternoon writing the “what this means” narrative under every chart, Whatagraph drafts it and the analyst edits, hours back every cycle for a shop producing dozens of reports a month.
Whatagraph paid plans starts around $812/month (unlimited users, all features) and an advanced plan on custom pricing with everything included.
What running Whatagraph standalone requires: a scheduler, since it’s a reporting layer, and a budget that fits mid-sized agencies and enterprises, SMBs and solo operators won’t use most of what they’d pay for.
One reporting dashboard for 30-plus marketing sources.
Coverage
- Analytik
- Benchmarking
- Berichterstattung
- Listening
- Multi-account
- Veröffentlichung
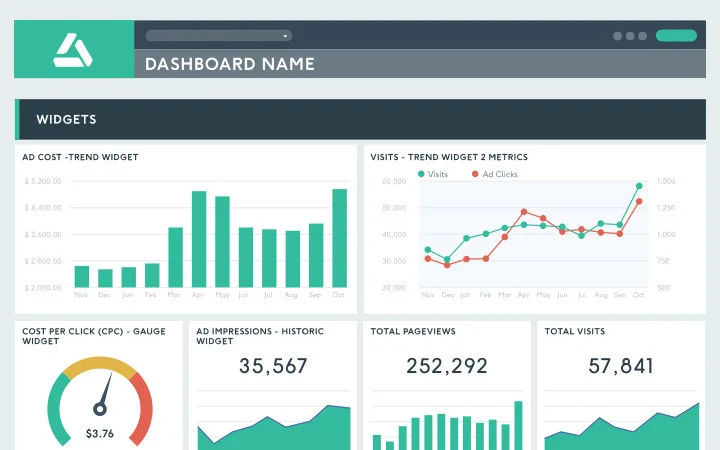
What it actually looks like: DashThis consolidates data from 30+ platforms – Google Analytics, PPC, SEO, display, and email, on a single dashboard. Need a source it doesn’t natively support? Import it by CSV, and once set up, those files auto-update every month so you never repeat the process. Built-in AI helps with report creation and interpreting your insights.
The auto-updating CSV import is the underrated part. If your business has one oddball data source no tool officially supports, a POS system, a niche ad network, an internal spreadsheet, you set it up once and it refreshes every month alongside everything else, finally closing that last manual gap.
DashThis pricing starts at $54/month for 3 dashboards after a 15-day trial, scaling to $164/month (10 dashboards), $324 (25 dashboards), and a custom plan from $499/month for 50+.
What running DashThis standalone requires: a scheduler and something to report on, it’s a reporting-only dashboard that earns its keep once you’re pulling several channels together, and it’s overkill for one or two platforms.
Find Deeper Comparisons by Platform
If most of your work lives on a single network, a platform-specific tool will often beat a generalist. These dedicated guides go deeper on the best options for each channel, including the free native dashboards worth pairing with a paid tool.
LinkedIn Analyse-Tools
LinkedIn’s built-in analytics cover the basics, but personal-branding and lead-gen teams usually want more, post-level trends, follower demographics, and consistent tracking over time. Tools like Taplio and SocialPilot fill those gaps, especially for anyone building a personal brand who needs to see which posts actually drove profile visits and connection requests over months, not days. For the full breakdown, see our dedicated LinkedIn analytics guide.
Instagram-Analyse-Tools
Native Instagram Insights and Meta Business Suite are a solid free start, but they don’t benchmark or export cleanly. Specialists like Social Status and Content Studio go further on reels, stories, and campaign reporting, and they hold historical data past the short window Instagram keeps natively, the difference between “this reel did well” and “reels have outperformed carousels for six straight months.” Dig in with our dedicated Instagram analytics guide.
Facebook-Analyse-Tools
For a single Page, Meta Business Suite gives you extensive data for free, and there’s little reason to pay for a tool if that’s all you manage. Managing multiple accounts or clients is where SocialPilot, Brand24, Keyhole, and Quintly earn their spot, one dashboard across every Page beats logging into each one. Compare them in our dedicated Facebook analytics guide.
TikTok-Analyse-Tools
TikTok’s native analytics are decent for a single creator, but agencies and brands need trend and benchmarking depth and TikTok’s own dashboard only holds a rolling window of data, so long-term tracking means exporting elsewhere. Exolyt, Mavekite, and SocialPilot are the ones to look at. See our dedicated TikTok analytics guide.
X (Twitter) Analytics Tools
X’s native analytics are limited, and third-party access has gotten pricier since the API changes — a real factor in what any X tool now costs. Talkwalker and Followerwonk still deliver deeper audience and follower insights, from follower quality to the best times your specific audience is active. Get the full comparison in our dedicated X analytics guide.
Key Factors in Choosing the Right Social Media Analytics Tool
The best tool isn’t the one with the longest feature list. It’s the one that fits your platforms, team, reporting needs, and budget. Consider these five factors before you buy.
Critical Capabilities
- Look beyond basic metrics. A strong analytics tool should cover audience insights, content and ad performance, competitor benchmarking, conversions, and ROI. Reporting is equally important, so prioritize customizable dashboards, KPI tracking, easy exports, and automated report delivery.
Choose platform coverage based on the networks you actually manage. If you focus on one platform, a specialist may offer more useful insights than a broad all-in-one tool.
- Facebook: Meta Business Suite, SocialPilot, Brand24, Keyhole, Quintly
- X: X Analytics, Talkwalker, Followerwonk
- Instagram: Instagram Insights, Meta Business Suite, Social Status, Content Studio
- LinkedIn: LinkedIn Analytics, Taplio, SocialPilot
- TikTok: TikTok Analytics, Exolyt, MaveKite, SocialPilot
Benutzerfreundlichkeit
The best analytics platform is one your team will actually use. Look for an intuitive dashboard, quick onboarding, clear visualizations, and reliable support.
Enterprise platforms such as Sprout Social offer deeper capabilities but can take longer to master. Simpler tools like Buffer and Planable sacrifice some depth for easier adoption. Choose based on your team’s skill level and reporting needs.
Data Accuracy
Reliable reporting starts with reliable data. Check how each tool sources its data, how frequently metrics refresh, and how much historical data it retains.
Pay particular attention to competitor and listening metrics. Some platforms use direct API data, while others rely on estimates or public signals. Understand how a metric is calculated before using it in client or executive reports.
Integration With Your Other Tools
Your analytics shouldn’t operate in isolation. Look for integrations with tools such as Google Analytics, Looker Studio, Power BI, and CRMs to connect social performance with website activity, leads, sales, and revenue.
This turns reporting from “engagement increased” into “social generated X leads and contributed to Y in pipeline.”
Kosten-Wirksamkeit
Compare tools based on average cost per user per profile/account, not the entry-level price. A low starting price can be misleading if you need additional users, accounts, or advanced reporting features as your team grows.
Consider the total cost of ownership, including user seats, social profiles, reporting limits, add-ons, and integrations. An all-in-one platform may be more economical than combining separate scheduling and analytics tools, while a specialist can justify its higher per-user cost if you regularly use its deeper benchmarking, listening, or reporting capabilities.
Choose the option that delivers the capabilities your team will actually use without paying for unnecessary features.
How We Tested and Curated This List
What We Actually Did
This list came from hands-on evaluation, not a feature-sheet copy job. We focused on the needs that actually matter for analytics: depth of insights, reporting and export capabilities, audience understanding, and data visualization. We also weighed customizability, integration options, pricing, and how well each tool scales as a business grows. The list isn’t ranked every tool here solves a different problem, and the goal is to help you match one to yours rather than crown a single winner.
We also held every tool to the same honesty standard, including our own. That meant naming a real limitation for each one, not just the ones we don’t sell. SocialPilot is on this list because it genuinely fits agencies and SMBs and it has no built-in social listening, which we’ve said plainly in its write-up and shown in the comparison table. A “best tools” list where the publisher’s own product has no downside isn’t a comparison; it’s an ad, and we’ve tried not to write one. Every review quote is a real user review with the reviewer’s name linked to the source.
What We Couldn’t Verify
Two things can change faster than any published list can keep up with. First, pricing: vendors frequently update tiers and promotional rates. Sprout Social, Buffer, Planable, and Agorapulse all made pricing or feature changes between June and August 2026, so treat the prices listed here as starting points and confirm them on each vendor’s official page before buying.
Second, enterprise features: some capabilities are only available through sales calls or custom quotes, which we couldn’t fully verify. If you find that a price or feature has changed, always trust the vendor’s live pricing or product page over any article or AI-generated result.
Find the Right Analytics Tool for Your Team
The choice comes down to one question: Do you want analytics built into the tool you already use, or a specialist focused entirely on measurement and reporting?
If you want scheduling, publishing, and reporting in one place, an all-in-one tool makes sense. SocialPilot is a strong fit for agencies and SMBs, while Agorapulse stands out for ROI tracking, Sprout Social for enterprise analytics and listening, Buffer for simplicity, and Planable for content teams.
If analytics is the priority, pair your scheduler with a specialist. Socialinsider and Rival IQ excel at benchmarking, Whatagraph and DashThis at cross-channel reporting, Agency Analytics at client dashboards, Social Status at Meta ads, and Tailwind at Pinterest and Instagram traffic.
Ultimately, choose based on the platforms you manage, the reports your team will actually use, and your budget. Test your shortlist with a real monthly report, the tool that turns scattered data into a report you’d confidently send a client is the one worth paying for.
Häufig gestellte Fragen
Was sind Analysetools für soziale Medien?
Social media analytics tools collect and analyze performance data from your social accounts, reach, impressions, engagement, follower growth, and conversions, so you can measure what's working and report it clearly. Popular options include SocialPilot, Agorapulse, Sprout Social, Buffer, Planable, Socialinsider, Rival IQ, Agency Analytics, Social Status, Tailwind, Whatagraph, and DashThis.
What are the best social media analytics tools?
The best all-around pick for agencies and SMBs is SocialPilot, which pairs deep white-label reporting with publishing. Sprout Social leads for enterprises, Buffer for creators, Socialinsider and Rival IQ for benchmarking and competitor intelligence, and Whatagraph or DashThis for cross-channel reporting. Match the tool to your platforms, team size, and budget.
Why isn't native platform analytics enough on its own?
Native analytics only show one platform at a time and can't compare channels, benchmark competitors, or build a client-ready report. The moment you manage more than one account, you're stuck copying numbers into spreadsheets by hand. A dedicated tool merges every platform into one dashboard and automates the reporting native tools can't.
What's a good free alternative to paid social media analytics tools?
Start with native analytics like Instagram Insights, Meta Business Suite, LinkedIn Analytics, and TikTok Analytics. For multi-platform reporting, consider third-party tools with free plans, keeping in mind that they may limit users, profiles, historical data, or reporting features.
Was sind die wichtigsten Metriken für soziale Medien, die man verfolgen sollte?
Track engagement (likes, comments, shares), reach and impressions, follower growth, click-through rate, and conversions, plus sentiment if brand perception matters to you. Engagement and reach show whether content lands; clicks and conversions show whether it drives business results. The right mix depends on whether your goal is awareness, community, or revenue.
What's the difference between social media analytics and social media reporting?
Analytics is the measurement, collecting and interpreting raw performance data to understand what happened and why. Reporting is the packaging, turning that data into a clear, shareable dashboard or document for a client or stakeholder. You need both: strong analytics with weak reporting means good insights nobody outside your team can read.
Do I need a dedicated analytics tool if my scheduler already includes one?
Often no. If your scheduler already offers cross-platform dashboards, competitor analysis, and white-label reports, as all-in-one platforms like SocialPilot and Agorapulse do, a separate analytics tool is redundant spend. Add a dedicated specialist only when you need advanced social listening, research-grade benchmarking, or reporting that pulls in SEO and paid data.
Über den Autor