Managing accounts, posting daily, running campaigns — you give it everything. But when reporting day arrives, that momentum dies. Suddenly you’re buried in tabs, copy-pasting numbers, chasing metrics across platforms, and watching hours disappear into a spreadsheet that still doesn’t look right. You’ve done the work. Real work. And yet the report sitting in front of you barely shows it.
It’s easy to assume the issue is too many clients or too much data. In reality, the bigger problem is the lack of a structured, repeatable way to turn scattered metrics into clear insights. Without that process, reporting becomes time-consuming and difficult to scale.
That’s why social media agencies and marketing managers rely on social media report templates and tools. They bring key metrics into one place, highlight growth, and make it easier to present real results across multiple accounts.
In this guide, you’ll learn how to create effective social media reports, explore different report types, and use ready-to-copy templates and tools to simplify the process, so reporting takes minutes, not hours.
Key Takeaways:
- A social media report turns scattered data into clear insights on performance, growth, and ROI.
- Start with defined goals and KPIs, your report is only as useful as what you measure.
- Focus on insights, not just metrics—explain what worked, what didn’t, and why.
- Use different report types (engagement, growth, campaign, competitor) to analyze performance from multiple angles.
- Keep reports visual, concise, and easy to scan so stakeholders can quickly understand results.
- Automating reports with tools like SocialPilot helps save time, reduce manual work, and deliver consistent reporting.
A social media report is a structured document that tracks, analyzes, and summarizes your social media performance over a specific time period. It compiles key metrics, such as engagement, reach, follower growth, conversions, and top-performing content to help marketers understand what’s working and what needs improvement.

Creating a social media performance report might be complex if you are unaware of the sequential steps. Here are the detailed steps to create social media report:

Before creating a dedicated social media performance report, you must define different objectives and KPIs to make the reporting process.
Goals and objectives provide a benchmark for measuring the success of your social media campaigns. By tracking your progress against your goals, you can determine whether your campaigns are on track or need improvement.
1. Establish Goals for Social Media Campaigns

Defining clear social media goals will help you measure the success of your marketing campaigns, so you must define the objectives of your social media campaigns.
These could include increasing brand awareness, generating leads, driving website traffic, boosting sales, etc.
Primarily focus on creating goals that are Specific, Measurable, Achievable, Relevant, and Time-bound (S.M.A.R.T). SMART goals can provide a clear direction and deadline for your social media efforts.
For example, through Instagram, you can set a SMART goal for your social media campaign to increase website traffic by 25% within the next three months.
The goal defines a specific objective of increasing the website traffic and has a quantifiable metric of a 25% rise. It can be achieved because it’s not too ambitious or unrealistic and is relevant because it aligns with the overall social media marketing strategy.
Also, it has a specific three-month deadline, making it time-bound. But there’s also another aspect of SMART goals, which is choosing a specific social media platform.
2. Choosing Social Media Platforms
You can choose the social media platforms if you know your buyer persona, ( and target market) and which platforms they are most active on. and which platforms they are most active on.
For example, if your target audience is primarily young adults, platforms like Instagram and Snapchat may be more effective, whereas if your target audience is professionals, platforms like LinkedIn and Twitter may be more appropriate.
Once you have identified the social media platforms that you will use, you can then determine the KPIs that are most relevant to those platforms.
3. Identify key Performance Indicators (KPIs)
Once you have established your social media campaign goals, you must identify the key performance indicators (KPIs) that will help you measure progress toward these goals.
Your KPIs can include metrics such as engagement, reach, impressions, clicks, conversions, and audience demographics.
For example, on Instagram, track metrics like engagement rate, follower growth, and reach, whereas, on LinkedIn, focus on metrics like engagement rate, click-through rate, and lead generation.
Step 2: Search Your Metrics
Once you have identified your KPIs, you must determine the metrics you must track. It can set up the foundation for creating an accurate and detailed social media report.
1. Choose Appropriate Metrics for KPIs
You need to choose the most appropriate metrics to measure and track them. For example, if your KPI is engagement, you may measure likes, comments, and shares.
Here are some tips for selecting the most relevant metrics for your organization or client:
- Align metrics with business goals.
- Focus on metrics that can be influenced through your social media efforts. For example, if you can’t control the number of followers you have, then measuring follower growth may not be the most useful metric.
- Use a mix of quantitative (likes and comments) and qualitative metrics (sentiment analysis.)
- Consider metrics specific to each platform.
2. Identify Sources of Data to Measure and Track Metrics
Next, figure out where you’ll be getting all the information that you need to create a comprehensive report.
Identifying the sources of data will provide insights for your social media report. You can extract data from social media platforms, third-party analytics platforms, website analytics, customer relationship management (CRM) tools, and other sources.
Whatever you choose, make sure it provides the insights you need to create a killer social media report!
It can be nerve-wracking to create social media reports for multiple clients. To ease your tracking and reporting process, you can rely on SocialPilot.
Its customizable social media reporting dashboard can help you with tracking all engagement metrics. You can get detailed analytics for specific channels or combine multiple profiles’ analytics on a single page and export striking PDF reports with ease.

Step 3: Create the Template
This step involves creating a template for social media report. You can choose a pre-existing template or create a custom one tailored to your needs.
Many social media report templates are available, each with benefits and features. Some popular templates include Excel spreadsheets, Google Sheets, PowerPoint presentations, and online dashboard tools.
However, you can avoid the trouble of manually adding the metrics and maintaining the data once you choose SocialPilot’s social media analytics.
Within a few clicks, you can generate a dedicated social media report based on the analytics results on platforms like Facebook, Instagram, Twitter, LinkedIn, and Google Business Profile.
Tip:If you want ready-made social media report templates with customization access, explore SocialPilot templates (Login > Go to the Analytics menu > select Templates).

Step 4: Build the Report
In this step, organize the data into a clear and concise format that is easy to understand.
This could include using charts, graphs, and tables to help visualize the data.
You need to track social media metrics based on the platform and your goals. For example, if you want to analyze your Facebook marketing strategy, you must measure your Facebook page’s performance by defining metrics like the growth of your fans/audience, likes, comments, shares, impressions, etc.
Once the data is available, you can format it into the desired visual graph, making it easier for a non-technical person to understand the reporting results.

Step 5: Analyze and Interpret Data
This step involves interpreting the data to draw insights and identify areas of strength and weakness. Based on your findings, make recommendations that will help you improve your social media strategy.
1. Interpret Data to Draw Insights
You need to interpret the data to draw insights about your social media performance. Look for social media trends, patterns, and anomalies in the data to help you understand what works and what doesn’t.
For example, if your audience engages more with videos than images, incorporate more video content into your social media strategy.
Also, if you notice a spike in follower growth after running a specific social media campaign, replicate the same campaign in the future.
2. Identify Areas of Strength and Weakness
Based on your analysis, identify the areas of strength and weakness in your social media strategy. This will help you make informed decisions about how to improve your performance.
You can use a SWOT analysis to identify areas of strength and weakness in your social media strategy. The framework can identify areas of strength and weakness in your social media strategy and help you leverage the information to make data-driven decisions.
Let’s understand SWOT analysis with an example of a fashion brand with a decent social media presence.
- Strengths: The strengths can include a visually appealing Instagram feed, decent social media engagement, and a loyal following of fashion enthusiasts
- Weaknesses: You can struggle to generate leads or sales through social media.
- Opportunities: To improve its weaknesses, you can partner with fashion influencers to reach a wider audience or use social media platforms like TikTok to showcase its products and reach a younger demographic.
- Threats: Competitors with stronger social media strategies can capture more attention, engagement, and market share. Additionally, frequent changes in social media algorithms and platform policies can reduce content visibility and impact overall performance.
3. Make Final Recommendations Based on Findings
Based on your insights, make recommendations for how to improve your social media strategy. These recommendations should be actionable and tied to your social media campaign goals.
For example, if your social media engagement is declining, here are ways to improve it:
- Create interactive content that encourages participation (polls, Q&As, quizzes)
- Share user-generated content (UGC) to build trust and community
- Experiment with different content formats like Reels, carousels, and short videos
- Post at optimal times when your audience is most active
- Write strong captions with clear CTAs (ask questions, invite comments)
- Use trending topics, audio, or hashtags to increase discoverability
- Run giveaways or contests to boost engagement quickly
- Respond to comments and DMs promptly to keep conversations active
- Collaborate with creators or influencers to reach new audiences
- Analyze past posts and double down on what’s already working
Also, blending your content strategy with new formats like Instagram Reels can deliver excellent results.
This step involves presenting your report clearly and concisely and sharing it with the relevant stakeholders. You should also prepare for future reports by tracking your progress and making necessary adjustments to your social media strategy.
How to Present the Report?
You need to decide how to present your social media report clearly and easily to understand, helping communicate your findings.
Choosing a detailed PDF format with multiple visual elements can make it easier for the stakeholders and your team members to analyze the social media reports.
If you get stuck during the process, wandering and looking for ideas, here are some examples of social media rep orts to get some inspiration.
Prepare structure for future social media reporting:
It’s also very important to prepare for future reports by documenting your process and method. This will help you maintain consistency across different reports and make it easier to track your progress.
You should also identify areas for improvement and set goals for future social media campaigns. Using the detailed steps, any team member can create a well-polished social media report and it help you improve current strategies and optimize your resources.
Social media reports can vary based on your goals, focus areas, and stakeholder requirements. Here are ten types of reports commonly used by social media teams to track performance and make data-driven decisions.
1. Audience Engagement Report
An audience engagement report analyzes how users interact with your social media content. It tracks engagement metrics such as likes, comments, shares, saves, and clicks to measure how responsive your audience is. This report helps identify which content types, formats, and messaging drive the most interaction.
Used to:
- Understand audience preferences and behavior
- Identify high-performing content formats
- Optimize social media engagement driven strategies
| Metric | Platform | Current Period | Previous Period | % Change | Notes |
| Likes | |||||
| Comments | |||||
| Shares | |||||
| Saves | |||||
| Clicks | |||||
| Engagement Rate |
2. Reach and Impressions Report
A reach and impressions report measures how visible your content is across social platforms. Reach shows the number of unique users who saw your content, while impressions represent how many times it was displayed. This report helps evaluate how effectively your content is distributed.
Used to:
- Measure content visibility
- Identify best times to post on social media platforms
- Improve distribution strategies
| Metric | Platform | Current Period | Previous Period | % Change | Notes |
| Reach | |||||
| Impressions | |||||
| Frequency | |||||
| Profile Visits | |||||
| Unique Users |
3. Follower Growth Report
A social media follower growth report tracks changes in your audience size over time. It monitors new followers, unfollows, and growth trends across different platforms or campaigns. This helps determine whether your social media strategy is effectively expanding your audience.
Used to:
- Track audience growth trends
- Evaluate campaign impact on follower acquisition
- Understand retention and churn
| Platform | Starting Followers | New Followers | Lost Followers | Final Followers | Growth % |
| TikTok | |||||
| X (Twitter) | |||||
| YouTube |
4. Sentiment Analysis Report
A social media sentiment analysis evaluates how audiences feel about your brand by analyzing mentions, comments, and conversations. It categorizes sentiment as positive, negative, or neutral to help understand brand perception across various social platforms.
Used to:
- Monitor brand perception
- Detect reputation risks
- Improve messaging and communication
| Metric | Jan | Feb | March | April | May |
| Positive Mentions | |||||
| Neutral Mentions | |||||
| Negative Mentions | |||||
| Total Mentions | |||||
| Sentiment Score | |||||
| Top Positive Theme | |||||
| Top Negative Theme | |||||
| Key Insights | |||||
| Action Items |
5. Competitor Analysis Report
A social media competitor analysis report compares your performance with key competitors. It evaluates metrics such as engagement rate, follower growth, and content strategy to identify competitive gaps.
Used to:
- Benchmark performance against competitors
- Identify opportunities for improvement
- Refine content and engagement strategies
For Facebook, SocialPilot’s free Facebook Competitor Analysis Tool is the fastest way to pull this data without building it manually. Track competitor page growth, engagement rates, posting frequency, and top-performing content in one place then feed those numbers directly into this report. It removes the manual lookup step and gives you a consistent data source every time you run this report. Similarly, you can also check out Instagram competitors’ tool to compare your performance with Instagram competitor accounts.
6. Campaign-Specific Report
A campaign-specific report measures the performance of individual social media campaigns. It analyzes metrics like reach, engagement, conversions, and ROI to determine campaign effectiveness.
Used to:
- Evaluate campaign success
- Measure ROI and conversions
- Improve future campaign planning
| Metric | Campaign 1 | Campaign 2 | Campaign 3 | Campaign 4 | Campaign 5 |
| Platform | |||||
| Campaign Goal | |||||
| Duration | |||||
| Reach | |||||
| Impressions | |||||
| Engagement | |||||
| Clicks | |||||
| Conversions | |||||
| Conversion Rate | |||||
| Spend | |||||
| ROI | |||||
| Top Performing Content | |||||
| Key Insights | |||||
| Action Items |
A social channel-specific report focuses on performance for individual platforms such as Instagram, LinkedIn, Facebook, or TikTok. Each platform has unique metrics, and this report helps tailor strategies accordingly.
Used to:
- Understand platform-specific performance and ROI
- Analyze channel-level metrics
- Optimize platform specific marketing strategies
1. Instagram Report Template
| Metric | Current Period | Previous Period | % Change | Notes |
| Followers | ||||
| Reach | ||||
| Impressions | ||||
| Profile Visits | ||||
| Engagement Rate | ||||
| Likes | ||||
| Comments | ||||
| Saves | ||||
| Shares | ||||
| Reel Views | ||||
| Story Views | ||||
| Website Clicks |
2. Facebook Report Template
| Metric | Current Period | Previous Period | % Change | Notes |
| Page Likes | ||||
| Followers | ||||
| Reach | ||||
| Impressions | ||||
| Engagement | ||||
| Post Clicks | ||||
| Shares | ||||
| Comments | ||||
| Video Views | ||||
| Link Clicks | ||||
| Page Visits |
3. LinkedIn Report Template
| Metric | Current Period | Previous Period | % Change | Notes |
| Followers | ||||
| Impressions | ||||
| Reach | ||||
| Engagement Rate | ||||
| Reactions | ||||
| Comments | ||||
| Shares | ||||
| Clicks | ||||
| CTR | ||||
| Profile Views | ||||
| Leads Generated |
4. TikTok Report Template
| Metric | Current Period | Previous Period | % Change | Notes |
| Followers | ||||
| Video Views | ||||
| Reach | ||||
| Likes | ||||
| Comments | ||||
| Shares | ||||
| Saves | ||||
| Average Watch Time | ||||
| Completion Rate | ||||
| Profile Views |
5. X (Twitter) Report Template
| Metric | Current Period | Previous Period | % Change | Notes |
| Followers | ||||
| Impressions | ||||
| Engagement Rate | ||||
| Likes | ||||
| Replies | ||||
| Retweets | ||||
| Link Clicks | ||||
| Profile Visits | ||||
| Mentions | ||||
| Hashtag Performance |
6. YouTube Report Template
| Metric | Current Period | Previous Period | % Change | Notes |
| Subscribers | ||||
| Views | ||||
| Watch Time | ||||
| Average View Duration | ||||
| Likes | ||||
| Comments | ||||
| Shares | ||||
| CTR | ||||
| Traffic Sources |
8. Content Analytics Report
A content analytics report evaluates the performance of individual posts, videos, stories, and reels. It identifies which content formats generate the most engagement and reach.
Use it for:
- Identify top-performing content
- Optimize content formats
- Improve editorial planning
| Metric | Post 1 | Post 2 | Post 3 | Post 4 | Post 5 |
| Platform | |||||
| Format | |||||
| Reach | |||||
| Engagement | |||||
| Clicks | |||||
| Engagement Rate | |||||
| Notes |
Custom reports are tailored to specific business goals that don’t fit standard categories. These reports can be adapted for influencer campaigns, customer support performance, or hashtag tracking.
Examples include:
- Influencer performance report
- Social customer care report
- Hashtag performance report
- Brand awareness report
- Crisis management report
These reports can be used for:
- Track unique business objectives
- Customize reporting for stakeholders
- Measure specialized campaigns
Using a combination of these social media report types helps you gain deeper insights, optimize strategies, and present meaningful results to stakeholders.
10. Monthly Performance Report
A monthly performance report gives a comprehensive overview of your social media activities over the past month. It’s perfect for identifying trends, measuring growth, and spotting areas for improvement. Key elements include:
- Total follower growth
- Engagement rates across platforms
- Social media traffic to the website
- Performance of top posts and campaigns
Use Case: Agencies use this report to demonstrate value to clients, while in-house teams share it with stakeholders to guide next steps.
Monthly Performance Report Template
| Metric | X (Twitter) | TikTok | |||
| Total Posts | |||||
| Follower Gain | |||||
| Follower Growth % | |||||
| Avg Reach/ Total Reach | |||||
| Total Impressions | |||||
| Avg Engagement Rate | |||||
| Website Clicks | |||||
| Conversion Rate | |||||
| Top Post (Link) | |||||
| Top Post Engagement | |||||
| Best Performing Content Format | |||||
| ROI | |||||
| Key Insight |
Crafting insightful, visually appealing social media reports doesn’t have to be a headache. The right social media analytics tools can save you time, simplify data collection, and help you create reports that wow your clients or team. Here are three powerful tools to elevate your reporting game:
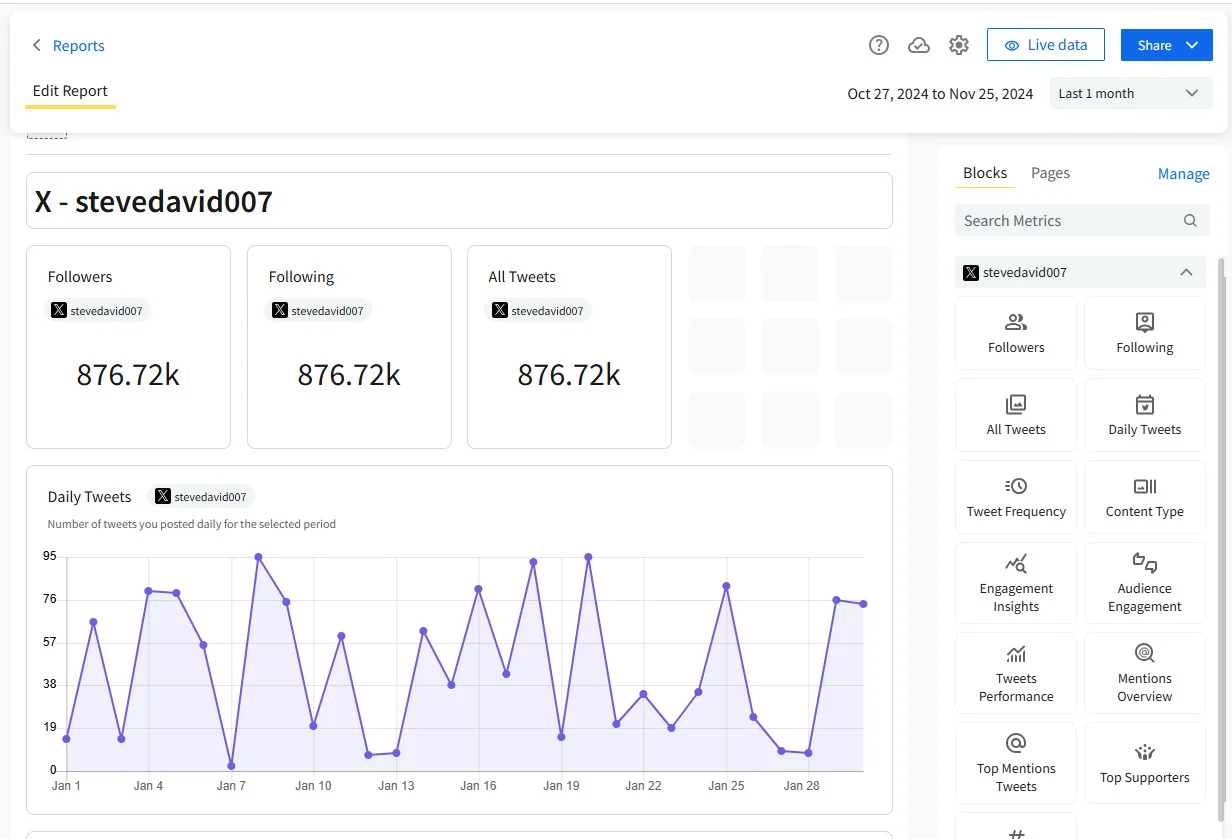
SocialPilot is a user-friendly social media reporting tool that helps automate and simplify analytics. It generates ready-to-share visual reports with key metrics like engagement, reach, and follower growth. With customizable dashboards and multi-platform tracking, it’s ideal for agencies and teams looking to save time while delivering clear, professional insights which is easy to undertand.
2. Hootsuite
Hootsuite offers robust social media analytics along with management features. It provides customizable dashboards to track engagement, audience growth, and campaign performance across platforms. With real-time insights and integrated scheduling, it’s a great choice for teams that want both publishing and in-depth reporting in one place.
3. Google Analytics
Google Analytics helps track how social media drives website traffic and conversions. It provides insights into user behavior, traffic sources, and goal completions. By connecting social efforts to real business outcomes, it enables marketers to measure ROI and optimize strategies beyond platform-level metrics.
Using the above tool, you can create reports manually with access to all key metrics and data,
but you can also automate monthly reports with zero time waste. Manual reporting gives you more control, while automation saves time, reduces errors, and makes it easy to scale your reporting without repetitive effort.
Instead of manually gathering metrics, you can automate social media reports using SocialPilot’s Custom Reports feature. Here’s how:
Log in to SocialPilot and connect your social media profiles (Facebook, Instagram, LinkedIn, X, TikTok, etc.). This allows the platform to automatically pull analytics data.
Step 2: Go to Analytics & Reports
Navigate to the Analytics section and select “Reports” to start building your report.

And, next click on “Create Report.”

Step 3: Choose Report Type
Select the type of report you want to generate:
- Platform-specific report using standard format or using existing templates
- Multi-channel performance report with templates
- Client report using blank report

Step 4: Customize Metrics (for weekly/monthly/custom dates report)
Select the metrics you want to include, such as:
- Engagement
- Reach and impressions
- Follower growth
- Top-performing posts
- Clicks and conversions
You can tailor the report based on your goals or stakeholder needs.
Step 5: Add Branding (Optional)
Customize your report by:
- Adding logo
- White-label branding
- Custom titles
- Notes or insights
This is especially useful for agencies managing clients.

Step 6: Schedule Automated Reports
Choose how often reports should be generated:
- Weekly
- Monthly
- Custom date range

SocialPilot will automatically generate and send reports on schedule.

Download reports as PDFs or share them directly with stakeholders via email. This eliminates manual formatting and saves hours of work.


Creating a social media report is one thing, but making it clear, actionable, and valuable is another. Use these quick tips to improve your reports and ensure stakeholders can easily understand performance and make better decisions.
- Highlight key takeaways at the top: Start your report with a short summary of the most important findings. This helps stakeholders quickly understand performance, major wins, and areas that need attention without reading the full report.
- Use visuals to simplify data: Incorporate charts, graphs, and tables to present metrics clearly. Visuals make it easier to spot trends, compare performance, and communicate insights more effectively than raw numbers.
- Focus on insights, not just metrics: Instead of only listing numbers, explain what they mean. For example, if engagement increased, mention the type of content or posting time that contributed to the improvement.
- Customize reports for your audience: Tailor the level of detail based on who will read the report. Executives usually prefer high-level summaries, while marketing teams may require detailed performance breakdowns.
- Compare performance over time: Include comparisons such as week-over-week or month-over-month. This helps identify trends, measure growth, and understand whether strategies are improving results.
- Highlight top-performing content: Showcase posts, campaigns, or formats that generated the best results. This helps guide future content planning and strategy decisions.
- Add clear recommendations: End your report with actionable next steps based on the data. This ensures stakeholders know how to improve performance moving forward.
- Keep the report concise and scannable: Use headings, bullet points, and short paragraphs to improve readability. A well-structured report saves time and makes insights easier to digest.
- Automate reporting where possible: Use social media reporting tools to automate data collection and scheduling. This reduces manual work and ensures consistent reporting.
A social media report helps you organize performance data, uncover insights, and improve your strategy. While you can build templates manually, collecting and managing data across platforms can quickly become time-consuming.
With SocialPilot’s reporting and analytics, you can create professional social media reports faster and with less effort. From tracking top-performing content to understanding audience growth, SocialPilot brings all your insights into one easy-to-use dashboard.
You can:
- Identify top-performing content
- Understand audience growth and engagement
- Discover your most active followers
- Find the best time to post
- Access cross-platform analytics in one place
- Schedule and share automated PDF reports
Explore SocialPilot’s pricing plans to find the right plan for your needs, and start your free trial.