
Your client’s contract is up for renewal in two weeks. You’ve sent them a report every single month for the past year, on time, formatted the way they like it. Then they ask the one question the report was never built to answer: “So what have we actually gotten out of this?”
You open the last twelve reports. They show reach, engagement, a follower count that’s climbed steadily. What they don’t show is a reason to keep paying you. That gap, between a report that documents activity and one that defends a decision, is the real problem behind social media agency client reporting, and it has very little to do with how much data you’re including.
Why Your Monthly Reports Aren’t Saving Renewals
Most agencies solve the renewal problem by adding more slides. More charts, more platforms, more screenshots. It doesn’t work, because the problem was never volume. If you’re still wondering how to report social media results to clients in a way that actually lands, the fix starts with understanding why the current version isn’t landing in the first place.
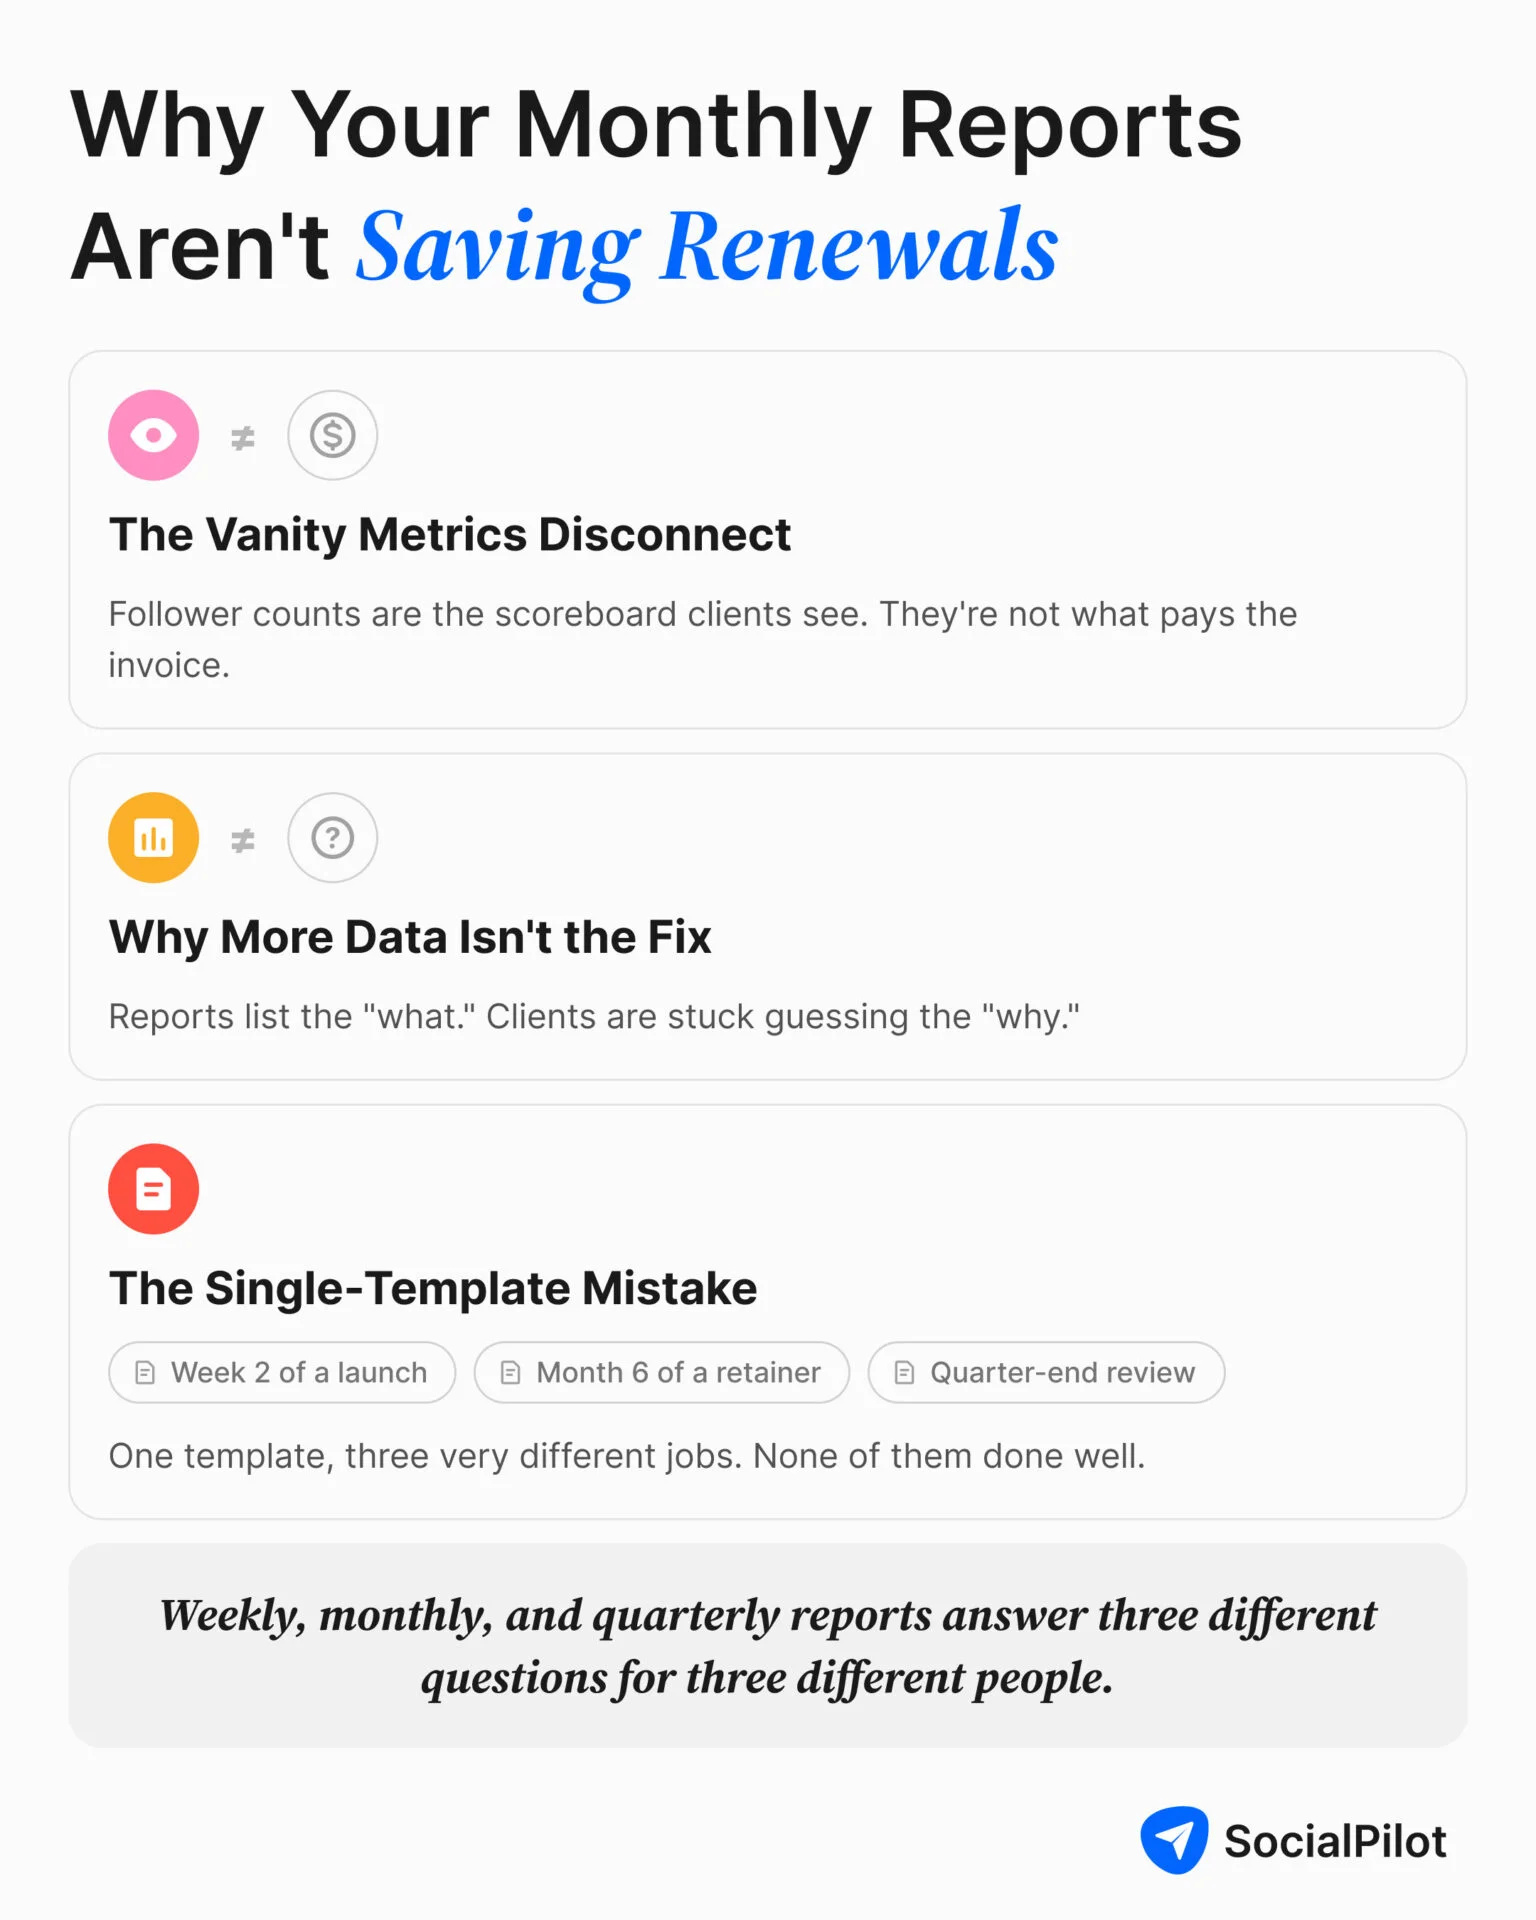
The Vanity Metrics Disconnect
Follower counts and likes are the numbers a client can see without ever opening a dashboard, so they become the unofficial scoreboard in every check-in call.
When your report leads with those figures, you’ve set your own bar at the metrics that matter least to the business paying the invoice. This is worth fixing before you touch anything else, since agencies that manage social media for multiple clients tend to hit exactly this wall once a handful of accounts all expect the same activity-first format.
Why “More Data” Isn’t the Fix
The actual failure isn’t a shortage of numbers. It’s a shortage of reasoning. A report that lists what happened without explaining why it happened, or what it means for the client’s business, leaves the reader to fill in the gap themselves, and most fill it in with doubt rather than confidence. Adding a fourth platform’s screenshots to a report that already has three doesn’t close that gap. It just makes the gap longer to scroll through.
The Single-Template Mistake
The deeper issue is that most agencies build one report and send it on repeat, regardless of whether it’s week two of a launch or month six of a steady retainer. What belongs in a social media report changes depending on which cadence it’s built for, and a single template stretched across all three tiers is why none of them do their job well.
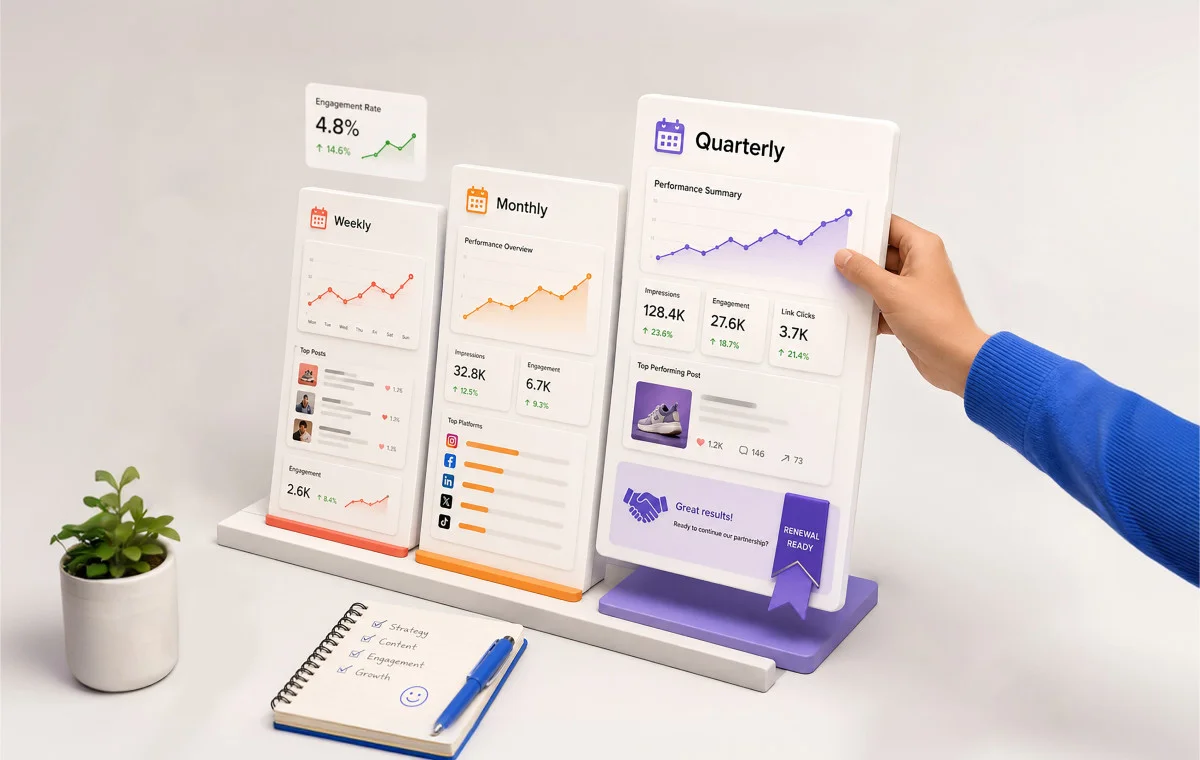
A weekly report, a monthly report, and a quarterly report are answering three different questions for three different people. This piece walks through what actually belongs in each one, and why the difference matters more than most agencies think.
The Three-Tier Reporting Framework: Matching Cadence to Decision-Making
Every cadence you report on exists to answer a specific question for a specific person. Once you separate those questions, the content of each report stops being a guessing game. Getting there also means knowing how to choose the right social media KPIs for each tier, since the social media reporting metrics that matter to a weekly check-in aren’t the ones that matter to a quarterly review.
Different Cadences, Different Questions
A weekly check-in answers “should we adjust this campaign right now?” A monthly report answers “is this retainer earning its keep?” A quarterly review answers “should we keep doing this at all?” Those aren’t the same question asked more or less often. They’re three separate decisions made by people who need different evidence to make them.
Mapping Stakeholders to Cadence
The account manager running an active campaign needs the weekly numbers to make a tactical call by Friday. The client stakeholder who approved the retainer reads the monthly report to judge whether the spend is still justified. Whoever signs off on renewal, sometimes that same stakeholder, sometimes someone above them, reads the quarterly review to decide whether the relationship continues at all. If your monthly report tries to double as a renewal document, it’s speaking to the wrong audience at the wrong moment.
The Framework at a Glance
| Tier | Reporting Audience | Primary Purpose | Key Metrics | Format | Approx. Production Time |
| Weekly Pulse Report | Account manager, internal team | Tactical adjustment during active campaigns | Post performance, ad spend, real-time engagement | Short dashboard snapshot or one-page summary | 15-30 minutes |
| Monthly Performance Report | Client stakeholder who approved the retainer | Show business impact and build the case for continued spend | Website traffic from social, lead form completions, conversions, supporting engagement data | Narrative report with visuals | 1-2 hours |
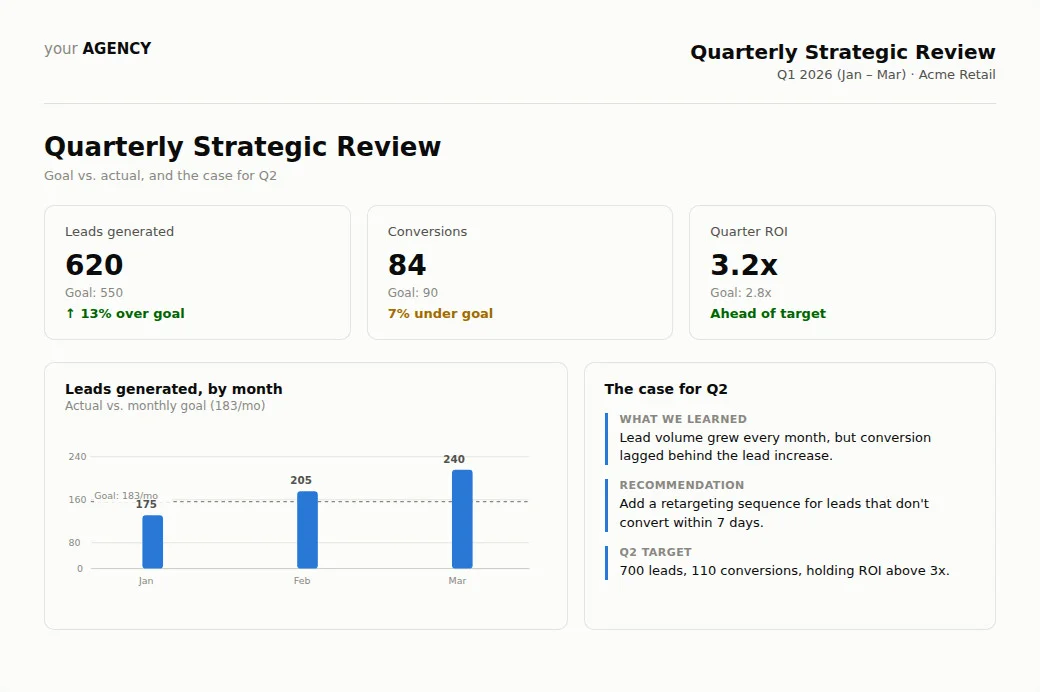
| Quarterly Strategic Review | Renewal decision-maker | Justify the retainer and set direction for the next quarter | Goal-vs-actual comparison, cumulative ROI signals, forward targets | Presentation or structured document, reviewed in a live conversation | 3-4 hours |
This table is the entire argument in one place. Everything below expands on what belongs in each row and why swapping the metrics between tiers can break reporting for most agencies.
Social media reporting frequency itself is one of the more contested questions in social media agency client reporting, and the data backs up a clear default. In Databox’s survey of 241 agencies, roughly 46% reported to clients monthly, compared to about 18% quarterly and 14% weekly. While these are not exact percentages, this tells us that monthly reports are default for most agency retainer clients, and weekly is the exception you add on top of it.
The Weekly Pulse Report
If you’re sending a weekly social media report to every client on your roster, you’re probably burning hours on a cadence most of them don’t need. The Weekly Pulse Report earns its place only during active campaigns, product launches, or any stretch where the account manager needs to catch a problem.
Outside of that window, weekly reporting isn’t a sign of diligence. It’s a sign that nobody’s decided what this client’s default cadence should actually be.
What Weekly Reports Are Actually For
The Weekly Pulse Report exists to answer a single question fast, and only that question:
- Is something happening right now that needs a tactical change?
It’s not the place for any of the following, no matter how tempting it is to add them in:
- Context on why a trend is developing
- Trend analysis stretched across weeks or months
- Business outcomes like traffic, leads, or conversions
Those belong in the monthly report. Repeating them here just slows down the one thing this cadence is supposed to do quickly.
The Right Metrics for a Weekly Cadence
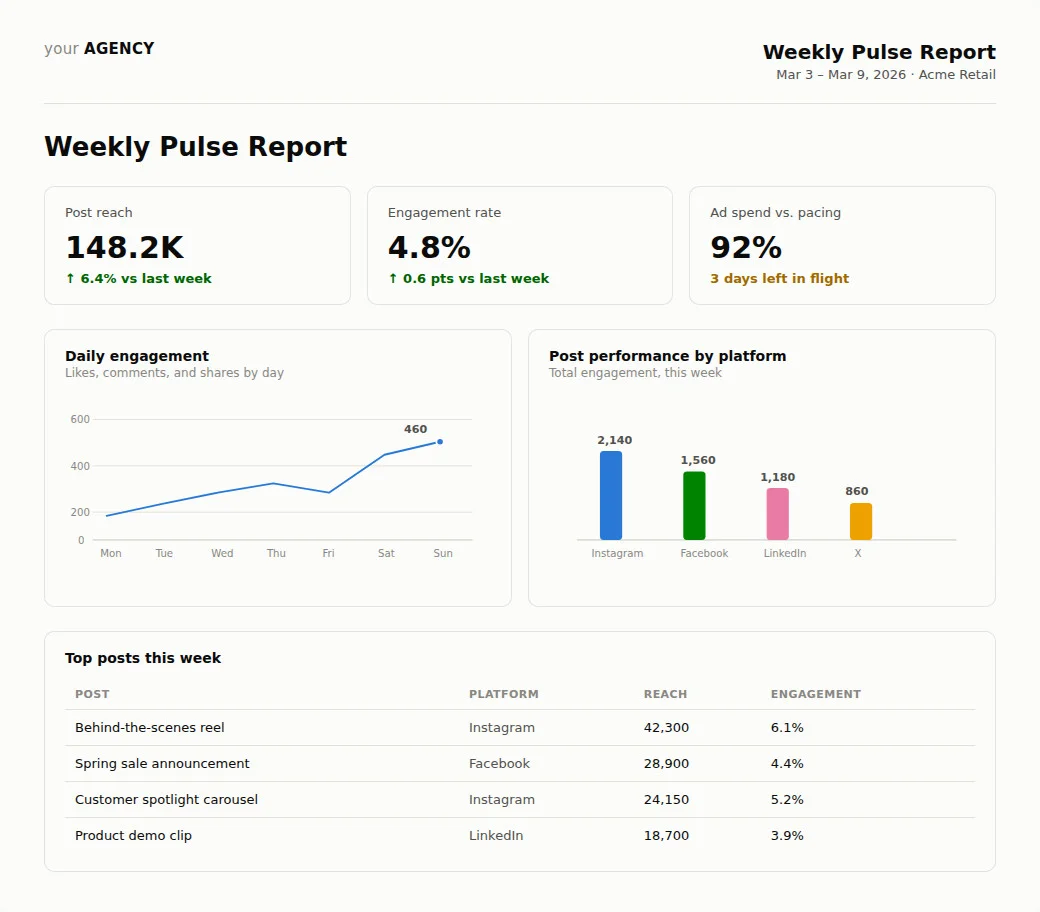
Keep this tier activity-focused. The metrics that let an account manager decide whether to shift budget, swap creative, or hold steady before the week is out. These include:
- Post-level performance
- Ad spend against pacing
- Real-time engagement signals
Skip follower growth and long-range trend lines here. A week is too short a window for either to mean anything.
Format and Delivery That Respects Everyone’s Time
A weekly report should hit two targets:
- Fifteen minutes to build
- Less than five minutes to read
A one-page dashboard snapshot, sent the same day every week, does the job better than a formatted deck. The image below shows what a weekly pulse report looks like.
The Monthly Performance Report
This is the report most of your clients actually read, and it’s also the one most agencies get structurally wrong. A social media agency monthly report built around platform activity tells the client what you did. It doesn’t tell them what it was worth.
Deciding what to include in a social media report at this tier starts with a simple test: Would this number change what the client does next? If not, it belongs further down the page, not at the top.
What Monthly Reports Are Actually For
The Monthly Performance Report exists to answer a different question than the weekly check-in:
- Is this retainer still earning its keep?
That means leading with outcomes the client’s business actually cares about, not a recap of what got posted:
- Website traffic that came from social
- Leads generated
- Conversions tied to specific campaigns
Engagement and reach still belong in the report. They just move down, framed as the mechanism behind those outcomes rather than the headline.
The Right Metrics for a Monthly Cadence
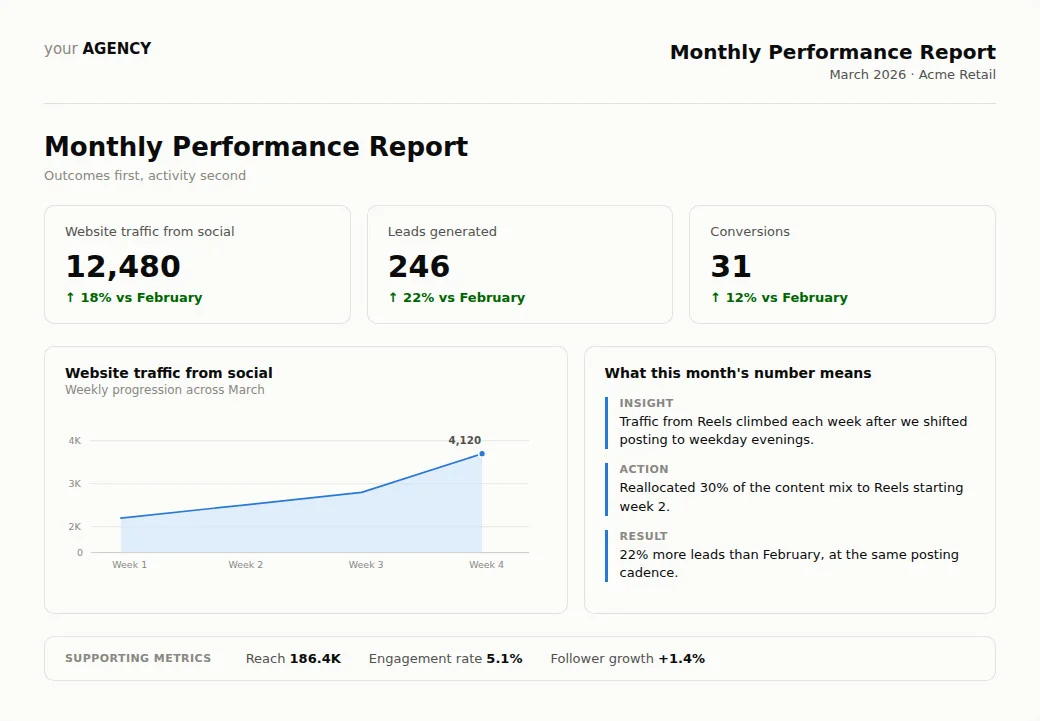
Lead with outcomes, and keep everything else as supporting evidence:
- Website traffic from social (primary)
- Lead form completions (primary)
- Conversions tied to campaigns (primary)
- Reach and engagement (supporting, not the headline)
- Follower growth (supporting, not the headline)
Reach and follower counts still matter, but only as supporting evidence. According to a Gartner survey, only 52% of senior marketing leaders can prove marketing’s value and get credit for its contribution to business outcomes, which means the client reading your report is often trying to build that exact case with the numbers you hand them.
Give them the numbers that make that case, not the ones that make your month look busy.
Structuring the Narrative: Insight, Action, Result
Every section of a monthly report should follow the same short structure:
- Here’s what changed
- Here’s the decision it drove
- Here’s the result
A follower count with no explanation invites the client to guess at its meaning, usually incorrectly. The same number attached to a decision and an outcome reads as strategy instead of activity.
The image below shows what a monthly performance report must look like for agency clients.
Proving ROI: The Minimum-Viable Attribution Setup
If a client has ever asked you to prove social media ROI to clients like their own board, and you didn’t have a clean answer, the gap is usually a tracking setup that was never built.
Three pieces cover most of it:
- UTM parameters on every link you post, so traffic is attributable down to the individual post
- Google Analytics goals configured for the actions that matter, form fills, demo requests, purchases, etc.
- A line in the monthly report that connects GA’s referral traffic straight back to specific social activity.
None of this requires a specialized attribution platform, and none of it should be presented with a made-up percentage. It’s a setup, not a formula, and it’s the single highest-leverage fix available to most agencies still reporting on reach alone.
Why Clients Stop Reading Reports
A report that opens with activity forces the client to do the interpretation themselves, and most won’t bother. Leading with the outcome first, then backing it with the activity that drove it, is the fix, and it costs nothing extra to build once the habit is in place.
This social media analytics guide will tell you what data to track and how to pull the outcome-level numbers in SocialPilot without switching between five different platform dashboards.
The Quarterly Strategic Review
A quarterly social media report isn’t a bigger version of the monthly one. It has a different job entirely: this is the document a client reads, consciously or not, while deciding whether to keep paying you.
What Quarterly Reports Are Actually For
The Quarterly Strategic Review exists to answer a different question than either of the other two tiers:
- Should we keep doing this at all?
That means the report has to argue for the next ninety days, not recap the last one:
- Less recap of what already happened
- More argument for what happens next
- Built as its own document, not three-monthly slide decks stitched together
If you’re assembling this report by pasting together three months of monthly slides, you’ve built a longer report, not a strategic one.
The Right Metrics for a Quarterly Report
Everything in this tier should point toward a renewal decision, not a monthly recap:
- Goal-versus-actual comparison against the targets set at the start of the quarter
- Cumulative ROI signals built from a full quarter of attribution data
- Forward-looking targets for the next quarter, specific enough that the client can hold you to them
A single month of data is noisy enough to argue either way. Three months of the same trend is much harder to dismiss.
Structuring the Narrative in Quarterly Reports
Three elements do the actual work here:
- Present a comparison of pre-decided goals and what was accomplished in the quarter
- Show what was learned, including what didn’t work and why you changed course
- Specific recommendations and targets for the quarter ahead, tied to a number the client can hold you to
Skip any of the three and the review reads as a status update instead of a strategic conversation. The image below shows what a quarterly strategic review looks like:
Running the Review as a Renewal Conversation
Present this one live whenever you can, not as an emailed PDF. A client who can ask a question at the moment and get direct answers about their social media ROI feel more assured. Also, three months of attribution data in quarterly reports tell a much steadier story than thirty days.
A lot of the friction that agencies hit during a renewal conversation with their clients trace back to goals that were never clearly set when the client was onboarded, which is exactly understanding what the first 90 days of a social media client must look like.
Building a Reporting Workflow That Doesn’t Eat Your Week
None of this framework matters if producing three different report types costs more time than sending one generic one to everybody. The fix is removing the manual assembly step that eats the time in the first place.
Where Agencies Actually Lose the Time
The hours disappear before a single word of analysis gets written. Logging into each platform separately, exporting the numbers, pasting them into a deck, then writing commentary on top, and repeating that same process for every client on the roster.
Agency communities online return to this complaint constantly; one thread in r/AskMarketing put it bluntly, asking how anyone actually prepares these reports without losing an afternoon to it every single time.
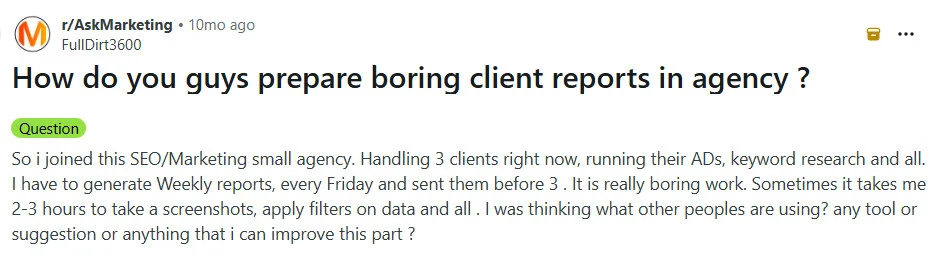
The manual pull, not the reporting itself, is what’s actually expensive.
A Tool-Native Workflow for Each Cadence Tier
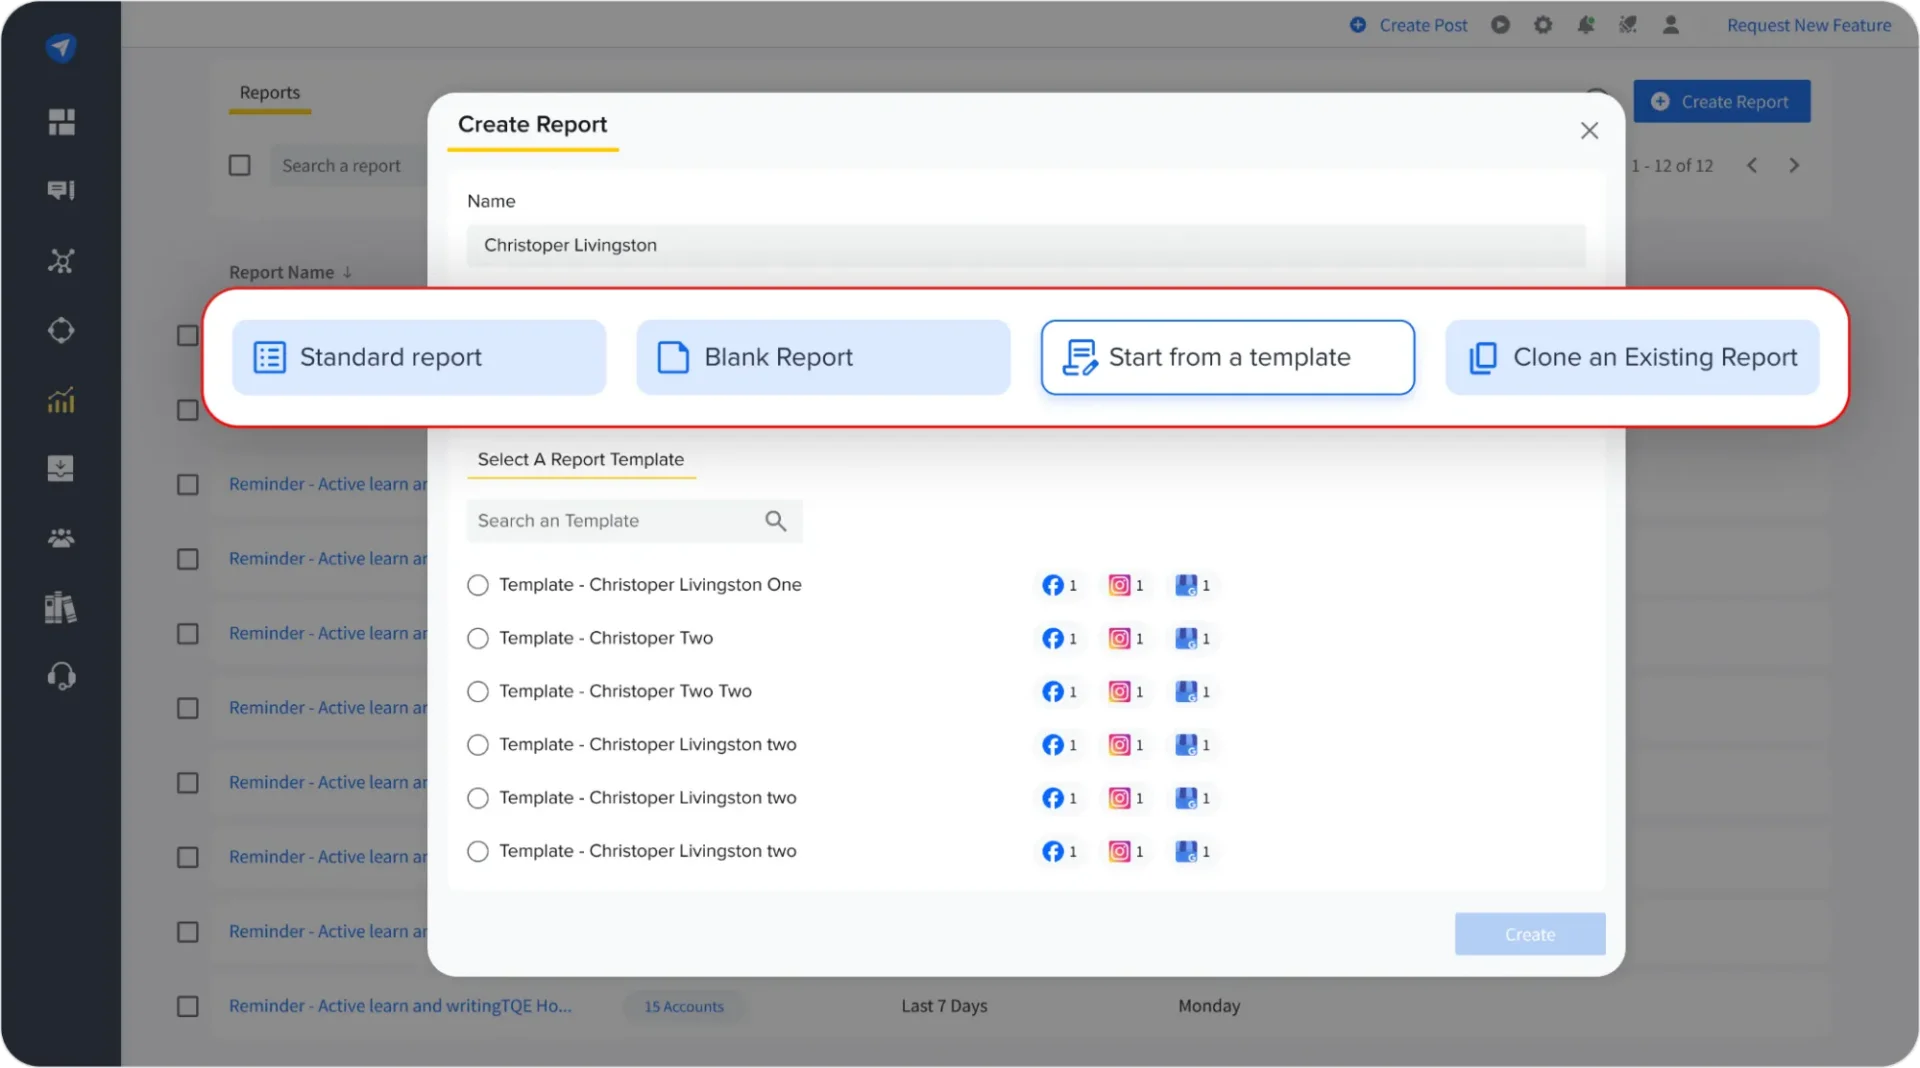
A platform built for this lets you set up separate templates once, one for the weekly pulse, one for the monthly narrative, one for the quarterly review, and reuse each one across every client instead of rebuilding a report from scratch every cycle.
SocialPilot lets agencies create and customize report templates per cadence tier and schedule them for automatic recurring delivery, so the weekly snapshot goes out every Monday without anyone opening a blank document, and the monthly and quarterly reports pull from the same connected data instead of three separate manual exports.
Putting Cadence on Autopilot
Most agencies don’t need a different reporting tool for each client. They need two or three templates that map to the tiers above, built once and reused with the metrics swapped in per client.
If your current process still means starting from a blank page every reporting cycle, that’s the actual bottleneck, and it’s worth reading how to automate white label social media reporting with SocialPilot if the weekly-monthly-quarterly split above sounds right in theory but exhausting to run in practice.
Not every agency reaches for dedicated social media reporting tools for agencies right away. Plenty still lean on spreadsheets and slide software instead, and those can hold the data well enough. What they can’t do is remove the manual work of pulling that data together every single cycle, which is the actual cost this whole framework is trying to get back.
The Report Is the Argument for Renewal
A report isn’t proof that you did the work. It’s the argument for why the client should keep paying for more of it. Get social media agency client reporting right at each cadence, and the renewal conversation stops being a surprise, because the case for it has already been building all quarter.
None of this requires rebuilding your reporting process from scratch.
If the templates-per-tier, scheduled-delivery approach described above is the direction you want to take, it’s the same workflow SocialPilot’s reporting tools are built around: one dashboard for every client, every cadence, with each report pulling from the same connected data instead of being rebuilt by hand every cycle.
Compare SocialPilot’s plans and pricing to find the tier that fits how many clients you’re reporting for.





 Join 55,000+ social media managers


