Have you ever posted a reel that went viral, only to see your next one flop with no explanation? Well, you know you’re not alone. One post gets thousands of views, and the next barely breaks double digits. The inconsistency is maddening, and the worst part? You’re left guessing what worked and why.
This is where Instagram Reels Analytics comes in. Not just to tell you what happened but to help you figure out why it happened, and what to do next.
Whether you’re a marketer, a creator, or an agency managing multiple accounts, analyzing the performance of your reels can show you exactly:
- What type of content does your audience actually care about,
- When your Reels perform best, and
- Which posts drive real engagement (not just vanity views)
In this blog post, we’ll break down the metrics that matter, how to use them to improve your content strategy, and how tools like SocialPilot can help you track, plan, and grow without guessing.
Let’s decode the data and turn your next Reel into one that performs with purpose.
Instagram Reels Analytics, in a Nutshell
What are Instagram Reels Analytics?
Instagram Reels analytics are the performance data tied to your short-form video content. This data shows you how many people watched your Reel, how long they stuck around, who engaged with it, and whether it actually led to profile visits or new followers.
In short, they tell you if your Reels are just being seen… or actually making an impact.
Instagram gives you access to a range of metrics, including:
- Views (aka plays)
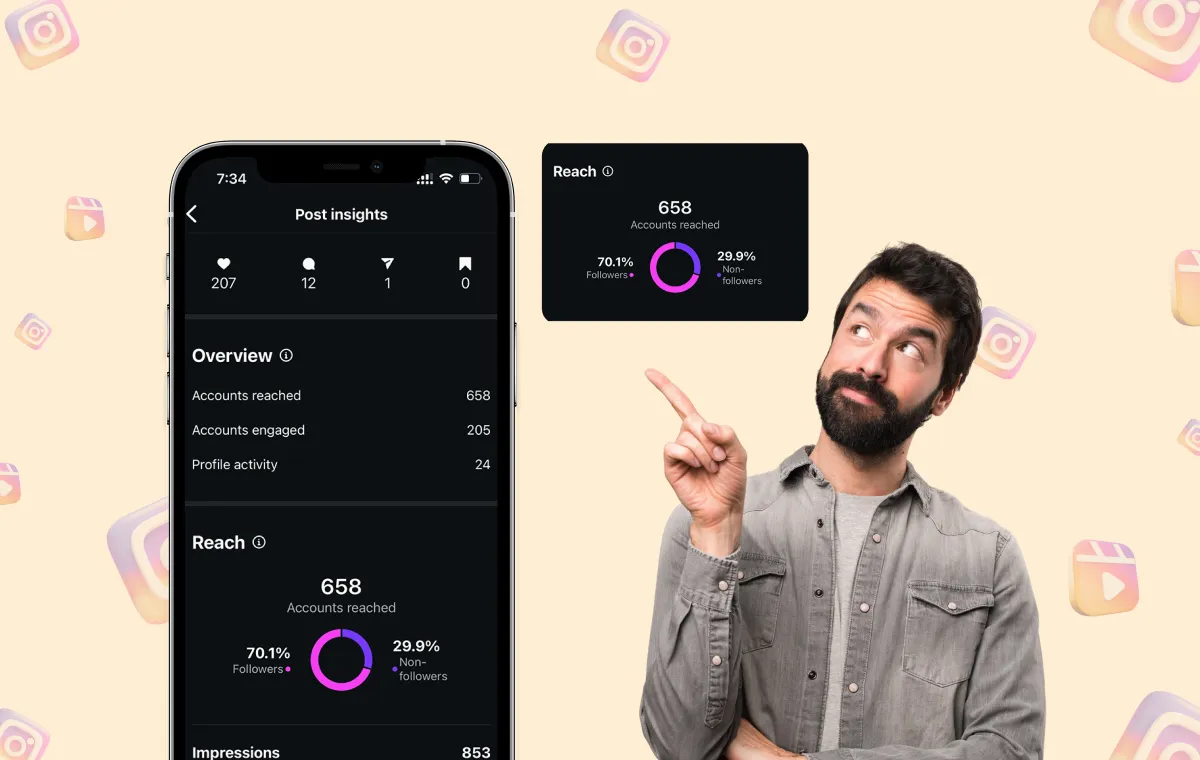
- Reach (how many unique accounts saw it)
- Watch time
- Engagement (likes, comments, shares, saves)
- Profile visits and follows from Reels
Thus, when understood correctly, they can help you identify the type of content your audience truly connects with. However, many marketers fail to use this data to enhance their content strategy fully. Let’s understand why this happens.
Why Most Marketers Check Them But Don’t Fully Use Them
Most creators and marketers do check these numbers, especially right after posting. But that’s often where it stops.
If you only check the numbers once, you’re missing the bigger picture. You look at total views or likes in isolation and assume that’s the whole story. But those numbers alone won’t tell you:
- Why didn’t a post reach beyond your followers
- Whether viewers actually watched past the first few seconds
- Which Reels are converting into new followers
- What’s repeatable, and what was just a one-off win
The solution? Instagram Analytics should be reviewed regularly, not just at the moment of posting, to track trends and optimize your content strategy over time.
Next, let’s break down exactly where to find these metrics and how to access Instagram Reels insights, step by step.
How to Access Instagram Reels Insights (Step-by-Step)
For Creator and Business Accounts
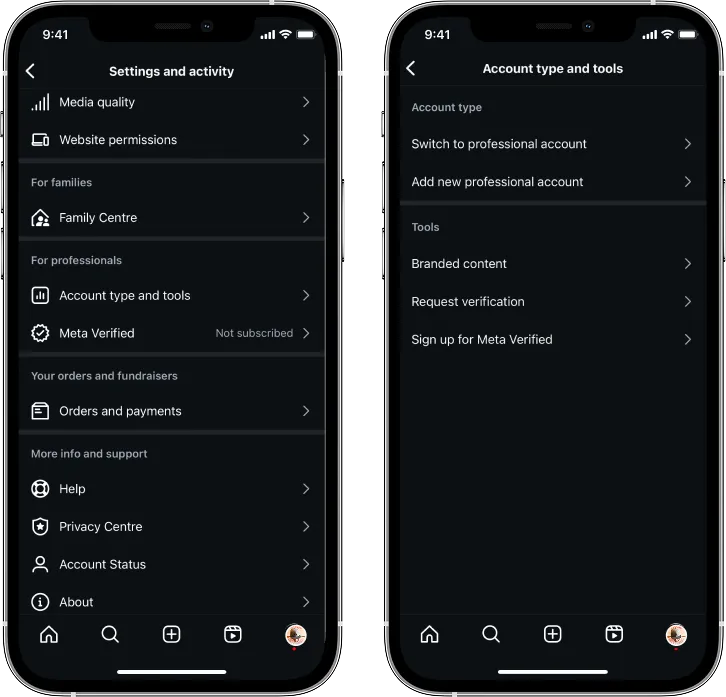
To access Instagram Reels analytics, you must switch to a Creator or Business account. Personal accounts don’t show insights for Reels.
To Switch:
- Go to your Instagram profile
- Tap the three-line menu in the top right
- Go to Settings & privacy > Account type and tools
- Tap Switch to professional account
- Choose either Creator or Business, depending on your needs
Where to Find Reels Insights In-app
Once you’ve posted a Reel, you can view its insights in two places:
Option 1: From Your Profile
- Go to your profile
- Tap the Reels tab (the play icon)
- Select the Reel you want to review
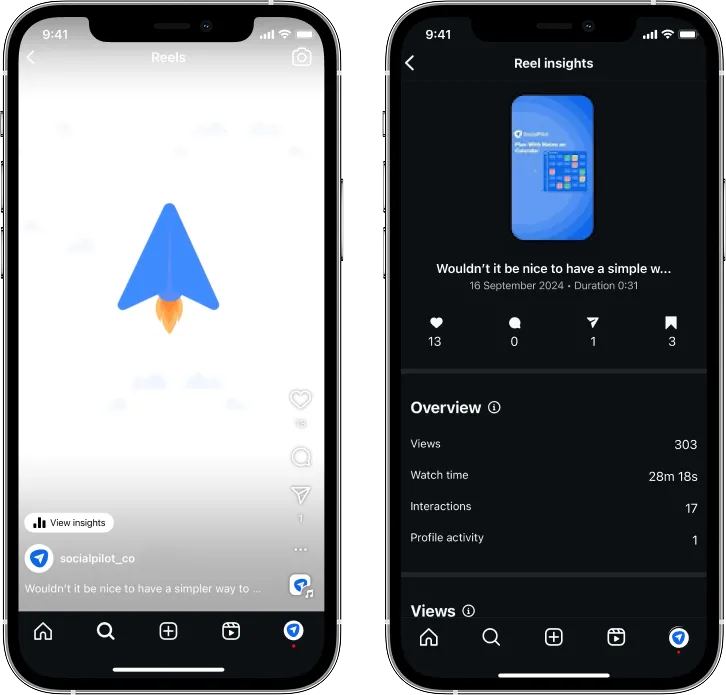
- Tap the three-dot menu (•••)
- Choose View Insights
Option 2: From Your Professional Dashboard
- Go to your profile
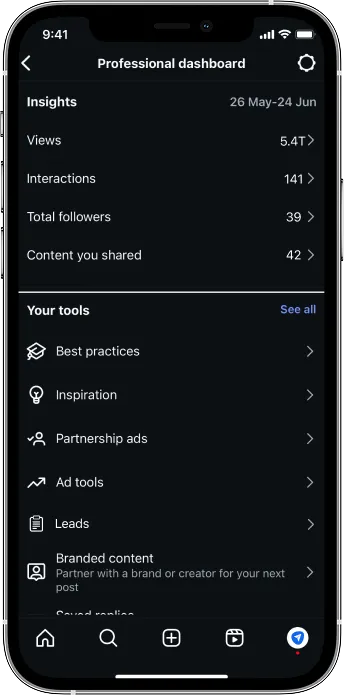
- Tap the Professional dashboard at the top
- Tap Account insights
- Scroll to the Reels section for an overview
Here, you’ll see metrics like reach, views (plays), likes, comments, shares, saves, and profile visits from each Reel.
Desktop Limitations and Smarter Workarounds
Instagram’s native insights are mobile-only, meaning you’ll hit a dead end if you try to access Reels analytics on a desktop.
While most people access social media on mobile, many marketers prefer desktop dashboards for reporting and strategy. This mismatch creates unnecessary friction in workflows. To bridge the gap, SocialPilot offers desktop dashboards that include:
- Reels-specific analytics
- Month-over-month trend reports
- Follower vs. non‑follower reach
- Easy PDF exports for client or stakeholder updates
Now that you are aware of where to find the Instagram insights, let’s move to what all do Instagram Reels Metrics comprise of and how you can use them to your best interest.
Instagram Reels Metrics Explained (And What They Actually Tell You)
1. Views (Plays)
- What it means: The total number of times your Reel was played, including repeat views.
- What it tells you: High view counts look impressive, but they don’t say much on their own. Instagram counts a view after just 3 seconds. So, high views don’t always mean people watched your content. A Reel with 50K views might’ve only reached 5K unique people who rewatched it, or been swiped away after 2 seconds.
- Use it to: Identify hooks or intros that pull viewers in. Pair this with Watch Time to understand real engagement.
2. Reach (Followers vs Non-Followers)
- What it means: The total number of unique accounts that saw your Reel, broken down by people who already follow you and those who don’t.
- What it tells you: This metric is pure gold if you’re aiming for discoverability. Reels are now shown to users based on “likelihood of watch time,” meaning your best content has a higher chance of going viral. A high non-follower reach = Instagram pushed your content to new audiences via the Explore or Reels tabs.
- Use it to: Track how well your content is expanding your audience. Reels with a strong reach-to-engagement ratio are worth replicating.
3. Watch Time & Average Watch Duration
- What it means:
- Watch Time = Total time viewers spent watching your Reel
- Average Watch Duration = Average time each viewer spent on it
- What it tells you: These metrics reveal content stickiness. If your average watch duration is low, people are swiping away early.
- Use it to: Test different video lengths, transitions, and pacing. The algorithm favors reels with higher average watch times.
- What it means: These are your core interaction stats
- Likes = passive approval
- Comments = conversation starters
- Shares = strong content value
- Saves = deep interest or intent to revisit
- What it tells you: The more saves and shares, the more your Reel is likely to be boosted in the algorithm. Likes are easy; saves are intentional.
- Use it to: Spot your most valuable content. If a Reel gets tons of saves but fewer likes, it might be resource-heavy or informative, but it’s worth doubling down on.
5. Follows from Reels
- What it means: The number of new followers who found you because of that Reel.
- What it tells you: This is the ultimate conversion signal, proof that your content was strong enough to make someone hit “Follow.”
- Use it to: Track which Reels are performing and converting. Analyze format, style, CTA, and even caption strategy. Remember, Instagram Reels reach 49% more audience than carousels and photos
6. Profile Visits
- What it means: How many people tapped into your profile after seeing your Reel.
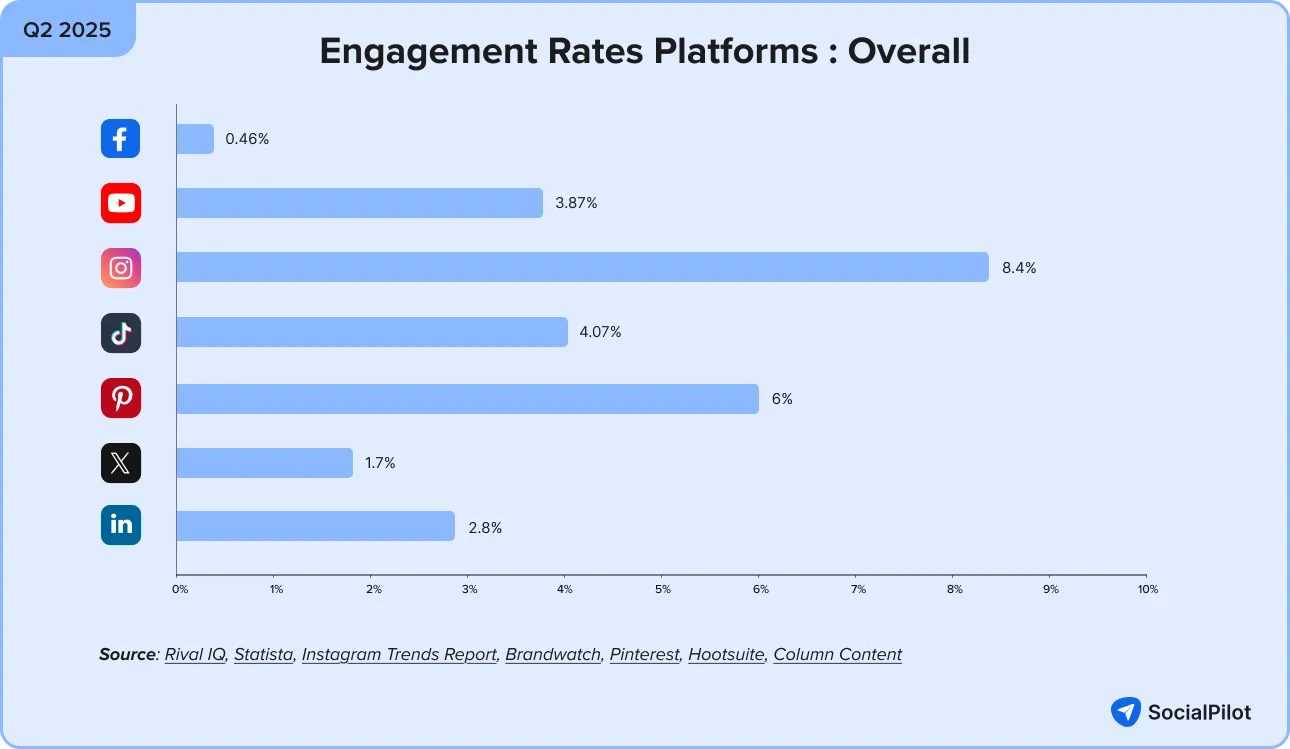
- What it tells you: You piqued interest. If your profile isn’t converting visitors into followers, your bio or highlights may need a tweak. Remember that Instagram Reels have an average engagement rate of 0.50%, which is higher than that of images (0.45%) but lower than carousels (0.55%).
- Use it to: Pair this with “Follows from Reels.” High-profile visits with low followers? Something’s off; test new bios, grid aesthetics, or pinned posts.
7. Completion Rate
- What it means: The percentage of viewers who watched your Reel from start to finish.
- What it tells you: A high completion rate indicates that your content is engaging and holds viewers’ attention. Conversely, a low completion rate suggests that viewers are losing interest before the end, which could affect your content’s performance in the algorithm.
- Use it to: Optimize your content by testing different formats, pacing, and calls to action. Instagram’s algorithm is more likely to promote reels with higher completion rates, increasing their reach and visibility.
So now, are you ready to track and analyze these metrics more effectively? Next, let’s see how SocialPilot’s Instagram Reels Analytics makes monitoring and optimizing your Reels performance easier, all from a single, user-friendly dashboard.
While Instagram offers fundamental insights, SocialPilot’s Instagram Reels Analytics goes further, offering you deeper and more actionable data.
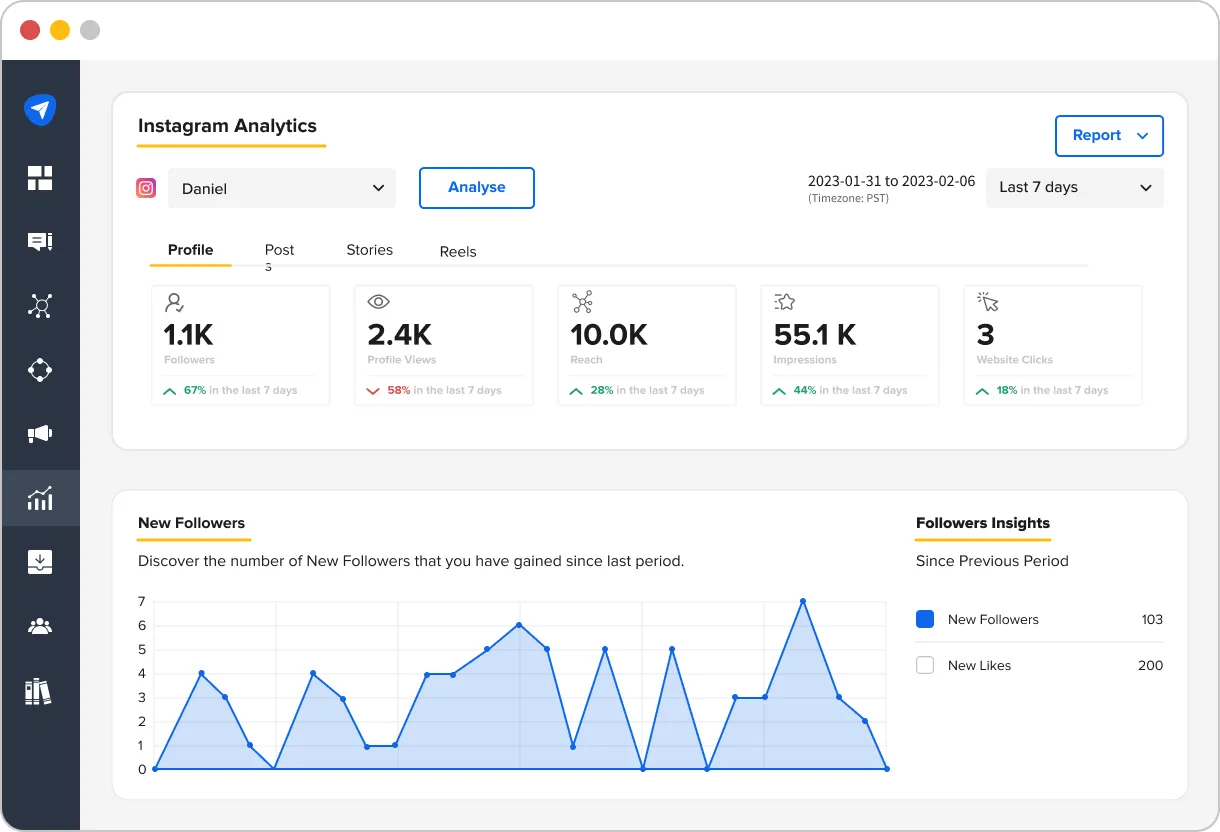
Here’s how SocialPilot makes it easier to manage and grow your Instagram Reels performance:
Track Individual Reels Performance
Dive into the specifics of each Reel, from views to saves to profile visits. With SocialPilot, you can track exactly how each piece of content is performing. This will help you optimize future posts with confidence.
Measure Follower Growth from Reels
See exactly how many new followers each Reel brings in. This feature helps you understand which content is converting casual viewers into loyal followers and which needs updating.
Access Month-on-Month Comparisons
Spot long-term trends and changes in your Reels performance. Compare metrics like engagement and reach month over month, helping you refine your content strategy to outperform previous months consistently.
Non-Follower vs. Follower Reach
See how much of your audience is from outside your current follower base. This gives you a clear picture of how well your Reels are reaching new people and expanding your brand presence.
Custom Reports for Better Insights
Want to showcase results to clients or stakeholders? SocialPilot lets you export custom reports that highlight the metrics you care about, making reporting a breeze.
By combining Instagram’s native analytics with SocialPilot’s enhanced reporting tools, you can access advanced features like month-over-month performance comparisons, follower vs. non-follower reach breakdowns, and customizable PDF reports. With these additional insights, you’ll have everything you need to track, refine, and grow your Instagram Reels strategy like a pro.
Let’s explore how you can use Reels analytics to optimize your content strategy and create more engaging content.
How to Turn Reels Analytics Into Actionable Insights for Growth
Reels are a great way to engage your audience, but only if you use the correct data for your strategy. Here’s how you can optimize your Reels for better performance by using key insights.
1. Spot What’s Working (and Double Down)
Start by identifying the types of content that consistently drive the most engagement, whether through a compelling topic, hook, or format. When you spot patterns in your most successful Reels, it’s a strong signal to replicate those elements in future posts, but with your own twist to keep them fresh.
2. Diagnose Low Reach or Poor Watch Time
Reels with high watch time are favoured by the algorithm and are twice as likely to reach a wider audience than those with lower watch time.
- Low reach often means the algorithm isn’t surfacing your content, possibly due to ineffective hashtags or targeting.
- Low watch time indicates that your hook or pacing isn’t grabbing attention.
In this case, try refining your captions and hashtags to align with what resonates most with your audience. Also, ensure your first few seconds pack a punch to keep viewers hooked throughout.
3. Plan Content Around Proven Themes and Hooks
Once you know what works, build on it by focusing on proven themes, topics, or formats that consistently perform well. Whether it’s educational, entertaining, or trending content, creating videos with a clear structure helps drive more engagement. Experiment with different types of content like tutorials, behind-the-scenes clips, or trending audio that fit within your niche.
4. Measure Retention and Drop-Off
Another critical metric to watch is retention and drop-off rates. A high retention rate shows that your content is engaging enough to keep viewers until the end, while drop-offs suggest the opposite.
To improve retention, start your Reels with a strong hook in the first three seconds and keep the pace fast to maintain interest throughout. SocialPilot’s Instagram Reels Analytics provides a comprehensive overview of these metrics, allowing you to easily track performance, identify successful content, and adjust your strategy based on what works.
5. Adapt Call To Action (CTA) Placement Based on Data
Always consider your call-to-action (CTA) placement. If your CTA isn’t driving the desired interactions like shares, saves, or comments, it might be poorly timed or hard to find. Test placing your CTA at different points in the video, mid-video, or at the end, to determine which positioning drives the most action.
By continuously analyzing these metrics and adapting your content strategy, you’ll be able to maximize your reach, engagement, and overall Reels performance.
In the world of Instagram, Reels are your gateway to growth, but only when you track and act on the ‘right’ data. Analytics provide the roadmap to help you understand what works, what doesn’t, and, most importantly, why.
By understanding the metrics behind each post, you can strategically optimize your content to drive higher engagement, more followers, and increased reach. With the right insights, data becomes your ally in making informed decisions that fuel your Reels’ success.
The key is not just to track but to act on what the data tells you.
So, stop guessing. Start analyzing.
And let your data guide the way to your next viral Reel!
Do you also feel like your Instagram Reels could do more? Let’s make it happen then.
Try SocialPilot’s Instagram Analytics today and get access to deeper insights, month-over-month comparisons, and customizable reports. With SocialPilot, you’ll have everything you need to confidently track, refine, and grow your Reels performance!
