

Your client leans back and asks the question every account manager quietly dreads: “So how do we actually stack up against our competitors?”
You can answer with opinions. Or you can answer with a number. Social media share of voice is that number.
It measures how much of the conversation in your category belongs to your brand compared with everyone else competing for the same audience. The challenge isn’t the math. It’s choosing the right competitors, using clean data, and knowing what the number actually tells you.
Get those right and share of voice becomes far more than another dashboard metric; it becomes an early signal of whether your brand is gaining or losing ground.
Social share of voice is the percentage of all brand conversation in your category that is about you, measured across social platforms.
It’s a competitive visibility metric, not an audience-size metric.
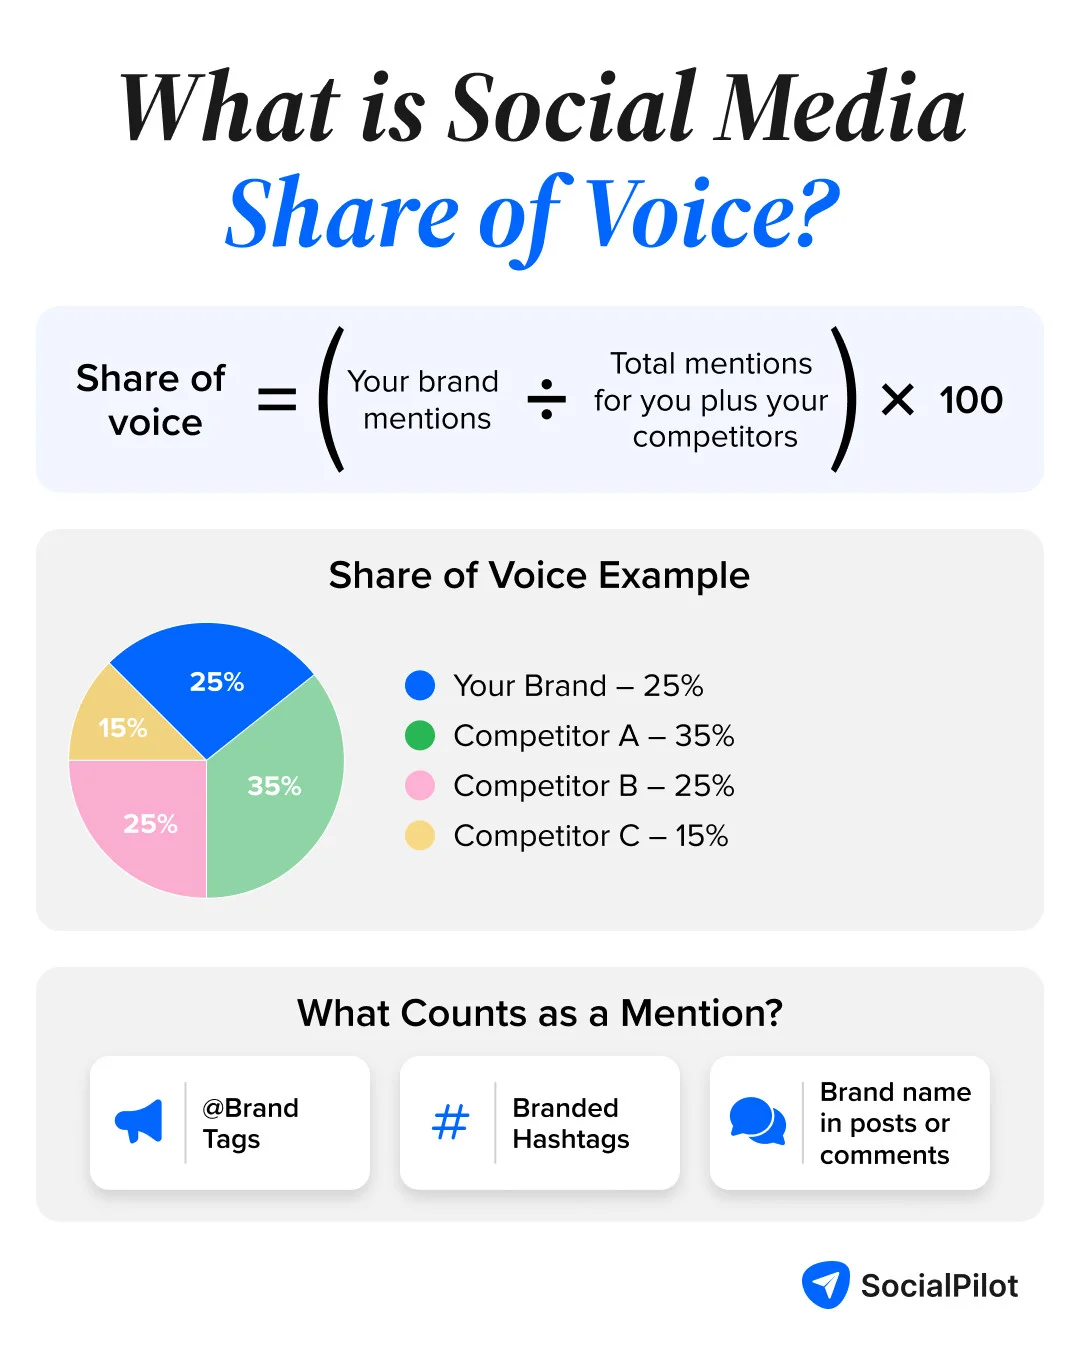
Here’s the one-line formula:
The word “mentions” is doing a lot of work there, so let’s pin it down. On social, a mention is any public reference to your brand:
- An @-tag
- A branded hashtag
- Your name typed in plain text inside a post or comment
Some teams count only the tags they get notified about. Better teams also count untagged text mentions, because that’s where most real conversation happens.
Two things make the social version different from the classic PR or ad-spend version:
- Your “market” is a defined competitive set, not the whole internet. You pick who counts as a competitor, and that choice shapes the result.
- You can weight mentions by engagement. A post that reached 50,000 people counts for more than one that reached 50.
We’ll do both versions for a brand next.
One honest note before you run with it: there’s no single official formula that every tool agrees on. As one practitioner puts it on LinkedIn’s advice pages, “Calculating SOV is not a one-size-fits-all formula, as different platforms and tools may have different methods and criteria.”
That’s not a reason to skip it. It’s a reason to pick one method and stay consistent.
Calculate share of voice in four steps:
- Define your competitive set.
- Count mentions for every brand in it over a fixed window.
- Add them up.
- Divide your count by the total and multiply by 100.
The only real decisions are who you compare against and whether you weight by engagement. Get those two right and the math is trivial.
Let’s work a real example. Say you run social for Roast House, a regional coffee brand, and your client wants to see how they stack up. You pick three real rivals as the competitive set and pull 30 days of mentions across the platforms you both live on.
Your results are only as good as your competitive set. A proper social media competitor analysis helps you choose brands that make the comparison meaningful.
Method 1: Mention Count
The simplest version counts every mention equally. So, let’s understand this concept with a simple example:
| Brand | Mentions (30 days) | Share of voice |
| Roast House | 1,200 | 25% |
| BeanBar | 2,400 | 50% |
| MorningCo | 900 | 19% |
| Craft & Brew | 300 | 6% |
| Total | 4,800 | 100% |
Share of voice for Roast House: 1,200 ÷ 4,800 × 100 = 25%.
Clean and defensible. It also tells a slightly deflating story, because BeanBar owns half the conversation on volume alone.
Method 2: Engagement-Weighted
Mention raw counts treat a viral post and a dead one the same. Engagement-weighted share of voice fixes that. You swap mention counts for total engagements (likes, comments, shares, saves) on the posts that mention each brand.
| Brand | Total engagements | Share of voice |
| Roast House | 60,000 | 29% |
| BeanBar | 72,000 | 35% |
| MorningCo | 45,000 | 22% |
| Craft & Brew | 30,000 | 14% |
| Total | 207,000 | 100% |
Now the picture shifts. Weighted by engagement, Roast House climbs to 29% and BeanBar drops from 50% to 35%.
Same month, same brands, different method, different story. Neither number is wrong. They answer different questions:
- Mention count answers “who gets talked about most.”
- Engagement-weighted answers “whose conversation actually lands.”
Pick one method per report and label it clearly, so nobody in the deck confuses the two.
What about Instagram or TikTok specifically? Same formula, platform-native metrics:
- On Instagram, count tags plus reach.
- On TikTok, count mentions plus views.
The formula never changes. Only the inputs do.
A quick word on data. If you pull these numbers from a listening tool, expect them to disagree with your native platform analytics. That gap is normal, and it usually traces to what each tool can see.
As LinkedIn’s advice pages note, “Many third-party tools have limitations as to what they can track due to API limitations from the social platforms themselves.”
Whatever source you choose, use the same one every month so your trend line compares like with like.
If you’re measuring share of voice for a one-off campaign or a monthly report, you don’t necessarily need an enterprise listening platform. These free calculators let you estimate your brand’s share of voice without a subscription.
- Mention Share of Voice Calculator: Calculates your brand’s share of voice by comparing brand and competitor mentions, with visual charts to help benchmark visibility. (Mention Share of Voice Calculator)
- Octolens Share of Voice Calculator: Measures share of voice across tracked brand and competitor keywords, helping you compare visibility and monitor competitive presence. (Octolens Share of Voice Calculator)
A few things to keep in mind:
- These calculators are ideal for quick benchmarking and reporting. For continuous monitoring, sentiment analysis, or real-time alerts, use a dedicated social listening tool.
- Also, accurate results depend on your keywords. Track your brand name, product names, branded hashtags, abbreviations, and competitor terms for the most reliable share of voice.
There’s no single magic number, and anyone who hands you one is guessing.
As a working rule, a share of voice in the 20% to 35% range signals real strength in most social categories. But the honest benchmark isn’t a fixed target at all. It’s your share of voice measured against your own market share:
- Voice bigger than your market share? You’re set up to grow.
- Voice smaller? You’re losing ground.
Team size changes what “good” even looks like. A solo founder and a 12-person brand team aren’t playing the same game. Here’s a realistic frame:
| Your situation | Reasonable goal | What “good” means here |
| Solo or founder-led, new entrant | 5% to 15% | Any measurable, growing slice against bigger rivals |
| In-house SMB team, established niche | 15% to 30% | Voice at or slightly above your market share |
| Agency-managed or category leader | 30% and up | Defending a lead while watching the fastest challenger |
Three factors move these ranges more than team size does:
- Category crowding. Five strong competitors caps everyone lower than a two-horse race.
- Specialist niche. If your client is the go-to expert, their share can sit far above their revenue rank.
- Viral spikes. One lucky post can inflate a month that means nothing about the trend.
That last point matters. Never judge share of voice from one snapshot. Judge it from the direction of travel over three to six months.
A brand sitting at a steady 18% and climbing two points a quarter is in better shape than one that hit 40% once and slid back. Always report the number with its trend, not just its level.
And set the target against your client’s actual position, not an industry average you read somewhere. A challenger stealing share should aim above its market share on purpose. A leader can hold steady and still be winning. The benchmark is relative, always.
These three get mixed up constantly, so here’s the clean separation:
- Share of voice is how much of the conversation you own.
- Market share is how much of the actual sales you own.
- Social listening is the practice you use to gather the raw material for both.
One is a leading indicator, one is a lagging indicator, and one is a method.
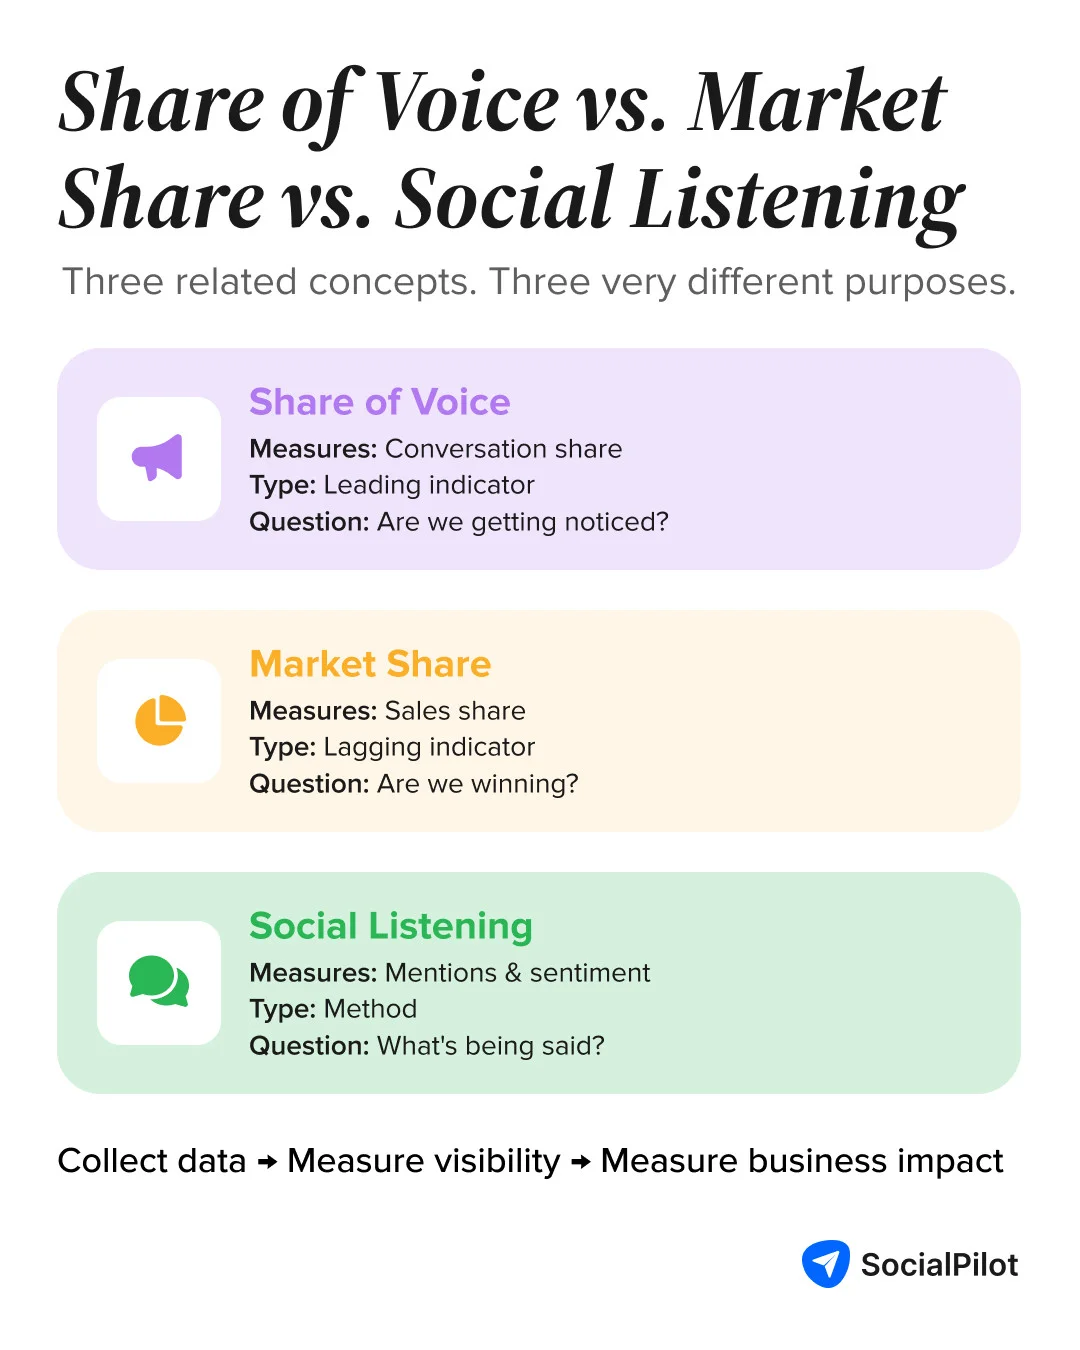
The link between the first two is the whole reason share of voice matters. Voice tends to move before sales do.
- When your share of conversation runs ahead of your share of the market, that gap signals growth is coming, assuming the attention is positive.
- When your voice slips below your market share, you’re quietly living off past momentum, and the sales numbers usually catch up later.
Social listening is the engine room. It’s how you capture mentions, tag sentiment, and spot the spikes in the first place. Share of voice is one output of that process, not a synonym for it.
One practical warning sits right at this intersection: social listening tools capture everything they can find, including spam, bots, duplicate mentions, and irrelevant conversations. Left unfiltered, that noise can inflate your numbers and distort your share of voice.
A share-of-voice report is only as reliable as the data behind it. So, clean your mentions before you calculate, and use the same listening source each reporting period so your trends remain comparable.
Excess share of voice is the gap between your share of voice and your market share. It’s the closest thing marketing has to a growth predictor.
The logic is simple:
- Brands whose voice runs ahead of their sales tend to gain market share.
- Brands whose voice trails their sales tend to lose it.
The gap is the leading edge.
This isn’t a social-media theory. It comes from decades of effectiveness data. Les Binet and Peter Field established the relationship in their IPA effectiveness databank analysis, “Marketing in the Era of Accountability”, drawn from hundreds of case studies.
Their key finding: a brand tends to gain roughly half a point of market share per year for every 10 percentage points of excess share of voice, with the exact rate varying by category. (WARC)
Here’s how that reads for Roast House. Say the brand holds 25% share of voice and 15% market share:
- That’s a positive excess of 10 points.
- It points toward slow, steady share gains over the coming year, all else equal.
Flip it, and a brand at 15% voice against 25% market share is running an attention deficit. It’s likely defending, not growing.
| Your numbers | The signal |
| Voice above market share (positive ESOV) | Set up to gain share over time |
| Voice equal to market share | Holding position |
| Voice below market share (negative ESOV) | Living off past momentum, likely to slip |
Two limitations worth noting of this study:
- The original research was built on advertising and total media, so treating a purely social number as a precise growth forecast overstretches it.
- The rule assumes the attention is positive. Ten extra points of voice from a product recall predicts nothing good.
Use excess share of voice as a directional early-warning system, not a revenue model.
You raise your share of voice by producing more relevant, higher-engagement conversation than your competitors do, consistently, over months.
There’s no single lever. It’s the compounding of a few habits, and the brands that win are the ones that keep showing up while rivals go quiet.
Here are the tactics that actually move the number:
1. Post Consistently, Not Occasionally
Share of voice is a share of a moving total. Go dark for three weeks and your slice shrinks, even if you do nothing else wrong. A steady cadence is the floor everything else builds on.
2. Join Trends While They’re Live
Timely participation in a trending sound, format, or conversation is the fastest legitimate way to spike relevant mentions. The window is short, so speed beats polish here.
3. Turn On Employee Advocacy
Your team’s combined networks dwarf your brand page. LinkedIn’s own business research notes that employees have, on average, about 10 times more connections than a company page has followers.
- That’s aggregate network size, not a promise that each post performs ten times better.
- But it’s real reach sitting idle, and it comes from real people, which tends to pull more genuine engagement than a logo does.
Switch it on and a slice of that network starts generating mentions you were never going to get from the brand account alone.
4. Talk Back, Don’t Just Broadcast
Replying, commenting, and joining threads generates mentions and engagement that pure publishing never will. Share of voice rewards being in the room, not just on the billboard.
5. Benchmark Monthly So You Can React
You can’t improve what you measure once a quarter and forget. Pulling the same competitive set every month turns share of voice from a slide into a habit.
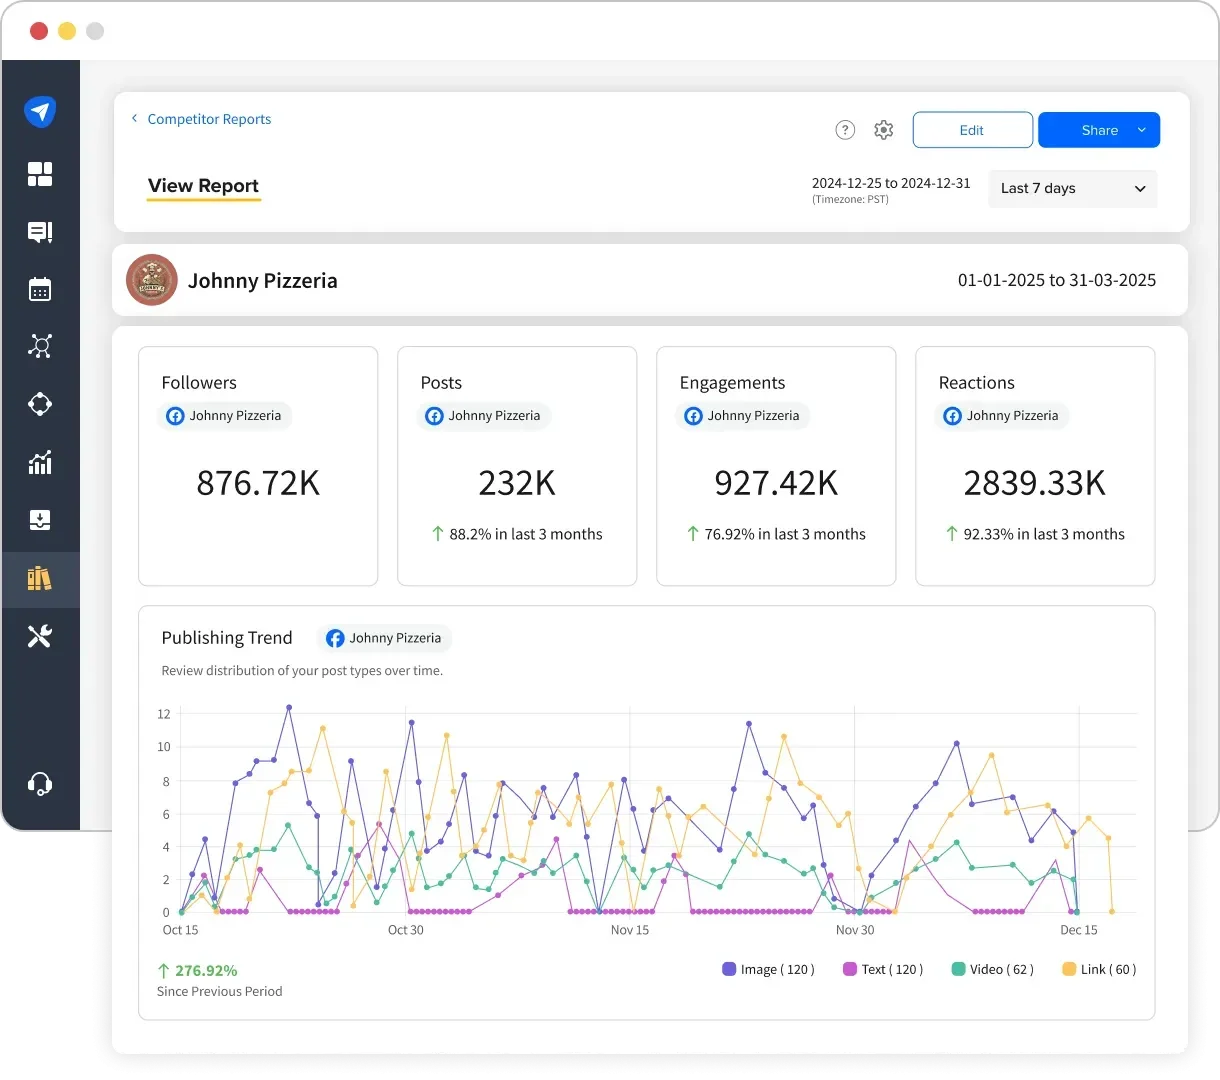
Pairing your scheduling with a built-in analytics and competitor tracking tool, like SocialPilot, lets you gather the same numbers on the same cadence instead of rebuilding the report from scratch each time.
The through-line is consistency. A brand that posts steadily, jumps on the right trends fast, activates its people, and actually talks back will out-voice a bigger competitor that treats social as a broadcast channel.
None of these tactics is clever on its own. Run together for two quarters, they compound.
AI share of voice is the percentage of AI-generated answers to category-relevant prompts that mention your brand, relative to your competitors, across assistants like ChatGPT, Perplexity, Google AI Overviews, Gemini, Copilot, and Claude. It’s also called AI visibility or share of model.
The idea is the same as social share of voice, moving to a new surface. When someone asks an AI “what are the best coffee brands,” how often does your name come up versus everyone else’s?
Now the honest part. There’s no standardized methodology across vendors yet:
- Each tool uses its own prompt sets, scoring, and model coverage.
- Two tools measuring the same brand will hand you two different scores.
- AI answers are probabilistic, so the same prompt can return different brands on different days.
That’s why credible tools report directional trends from repeated sampling, not a single absolute number you can take to the bank.
There’s a second trap worth knowing: being mentioned isn’t the same as being cited as a source. According to Search Engine Land’s AI Visibility Index, fewer than 25% of the most-mentioned brands in AI responses are also the most-cited sources.
Getting named in an answer and being the link the model trusts are two different wins. Most tools measure only the first.
These are the real tools for AI visibility:
- Profound: Tracks how often your brand appears across AI assistants, monitors AI crawler activity, and measures overall AI visibility trends. (Profound)
- Peec AI: Helps monitor brand mentions across major AI search engines and assistants, making it easier to benchmark AI visibility against competitors. (Peec AI)
- Otterly AI: Tracks brand mentions in AI-generated answers, measures Share of AI Voice, and monitors changes in visibility over time. (Otterly AI)
- Semrush AI Visibility Toolkit: Measures AI Share of Voice alongside brand visibility across AI search experiences, with competitor tracking and performance insights. (Semrush AI Visibility Toolkit)
For agencies folding AI visibility into an existing routine, the same discipline that runs your social benchmarking applies here. Setting up AI-powered competitor monitoring is a smart way to start tracking it alongside the social numbers you already pull.
Just report it as a trend and say plainly that the methodology is still settling.
Share of voice misleads when you read the number without reading what’s behind it. A rising line can mean people love you, or that they’re furious with you, and the metric alone can’t tell the difference.
Three mistakes cause almost all the bad calls.
Mistake 1: Ignoring sentiment. A mention spike looks like a win in a dashboard while actually reflecting a pile-on. As Muck Rack puts it, “Not all coverage is created equal. In the event of a PR crisis, you could see your SOV ballooning overnight.”
Always pair the number with sentiment before you present it, or you risk celebrating a fire.
Mistake 2: Treating it as proof of business impact. It isn’t. In the words of Michael Brito at Britopian, “A high SOV might look impressive in presentations, but it tells you little about actual business impact.”
Share of voice is a leading signal of attention, nothing more. Tie it to engagement, traffic, or conversion before you claim it drove results.
Mistake 3: Trusting dirty data. Counts built on unfiltered mentions include spam, bots, and off-topic noise that quietly inflate the number. Clean the set first, and build a repeatable way to monitor social media mentions so the same filters run every month.
A defensible metric starts with a clean input, not a clever formula.
None of this means share of voice is a vanity metric. It means it’s a metric with conditions. Report it with its trend, its sentiment, and a clean data source, and it holds up in any room. Report it raw, and someone will rightly poke a hole in it.
Social media share of voice is valuable because it tells you where your brand stands before sales numbers catch up. It won’t replace revenue metrics, but it gives you an early read on whether your campaigns are earning attention, how you compare with competitors, and where you need to adjust your strategy.
The key is consistency. Use the same competitive set, the same data source, and the same calculation method every reporting period. That way, you’re tracking real movement, not changes caused by different inputs.
As your reporting matures, pair share of voice with engagement, sentiment, and conversion metrics to understand not just how much people are talking about your brand, but whether those conversations are driving business results.
If you’re ready to monitor competitors, track performance, and build client-ready reports from one place, explore SocialPilot’s pricing to see which plan fits your team and reporting needs.





 Join 55,000+ social media managers


