Did you know? As per the Statista data, YouTube has 2.5 billion monthly users and 114 million channels, but only a handful truly break through.
What sets them apart? Simple: they don’t guess, they use data. 90% of top-performing videos are powered by intelligent, data-driven optimization.
Our YouTube expert has crafted this guide after in-depth analysis, showing you exactly how to use YouTube analytics data and transform those insights into real channel growth.
So, what is YouTube Analytics?
YouTube Analytics is the built-in feature that shows how your videos and channel perform.
By using the YouTube Analytics dashboard, marketers can track key metrics like watch time, views, traffic sources, engagement, and audience behavior, giving them a complete picture of what’s working and what’s not.
How to See YouTube Analytics?
To check your analytics, you’ll use YouTube Studio. It is the control center for your channel. It lets you upload videos, manage content, and track performance in one place.
Steps to See YouTube Analytics on Desktop
To head to YouTube Analytics on desktop, you can follow the steps:
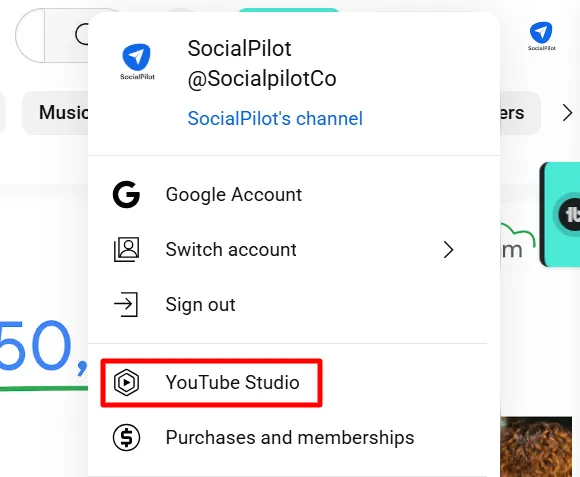
Step 1: Sign in to your YouTube account and click on the profile icon in the top right corner.
Step 2: Now, click on YouTube Studio to access the analytics dashboard
Step 3: On the left menu bar, you will find the “Analytics” option, select that.
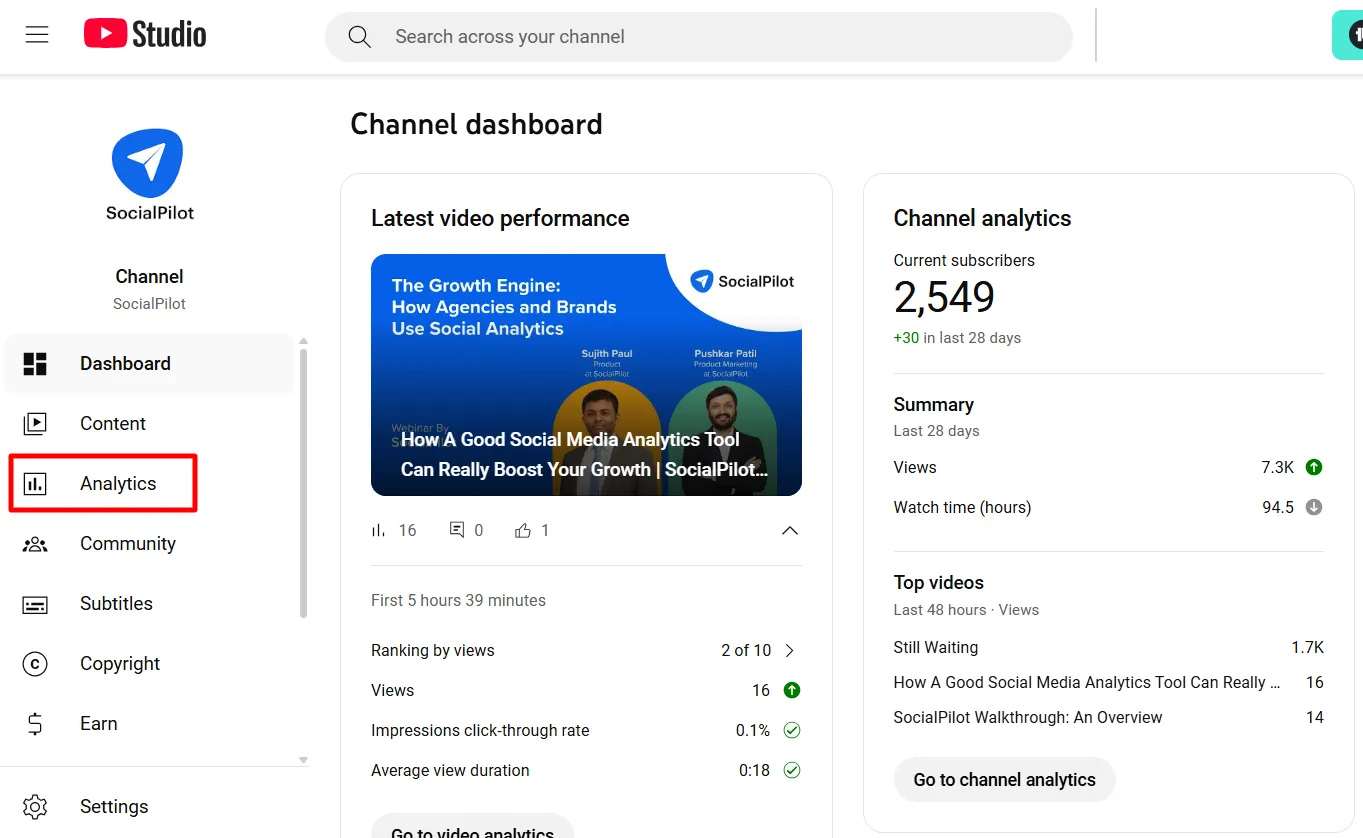
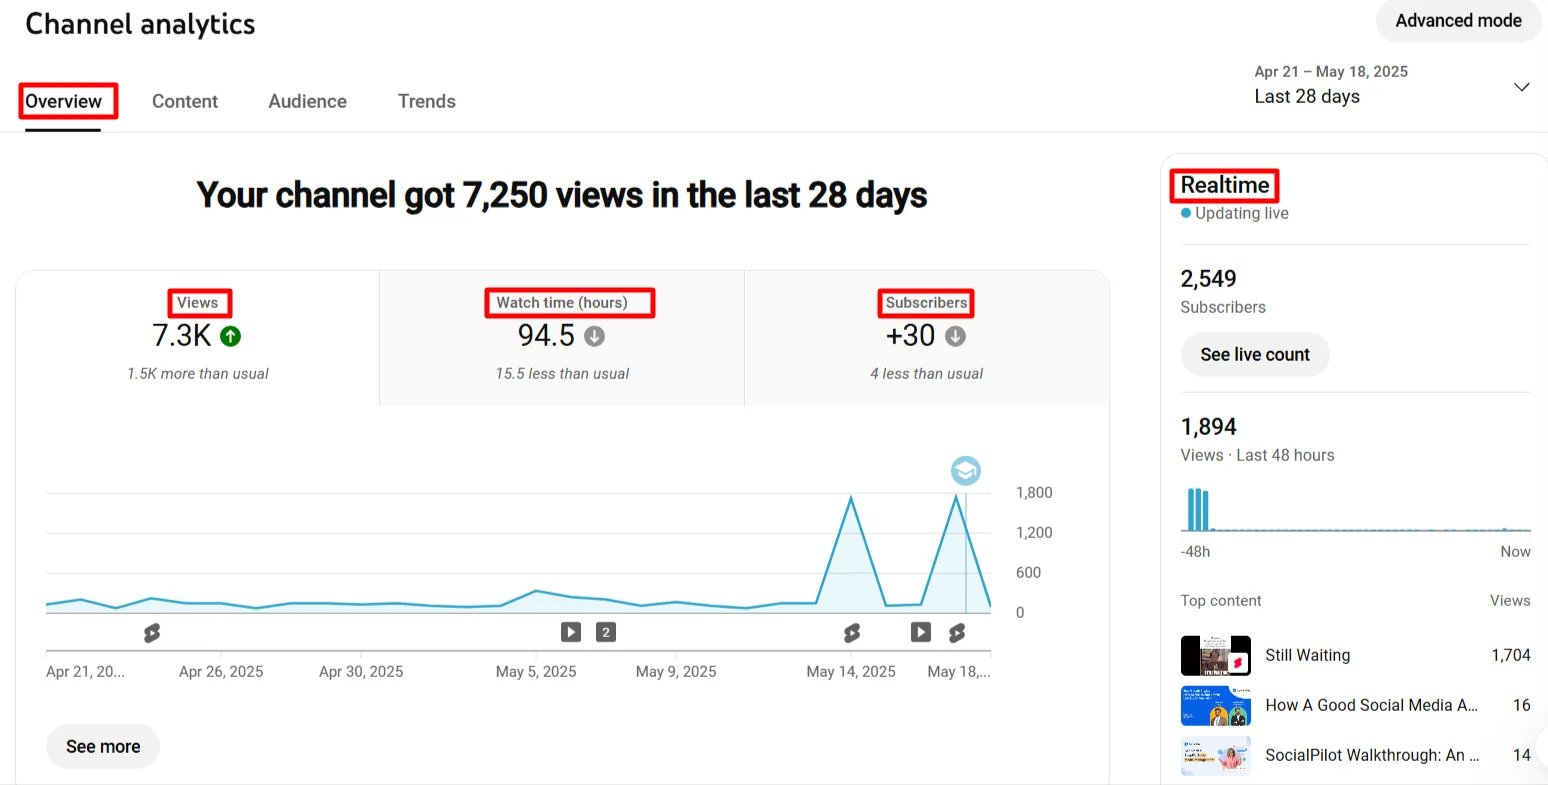
You will find the “Overview” tab selected by default on the channel analytics page, giving you an overview of the channel. Here, you can get a detailed YouTube analytics report by clicking the “Advanced Search” option.
Steps to Find YouTube Analytics on a Mobile Phone
To access YouTube Analytics via your mobile phone, follow the steps:
Step 1: Download the YouTube Studio app on your mobile phone and sign in to your account.
Step 2: You will see the “Analytics Tab” on the dashboard once signed in. You can click to see further details.
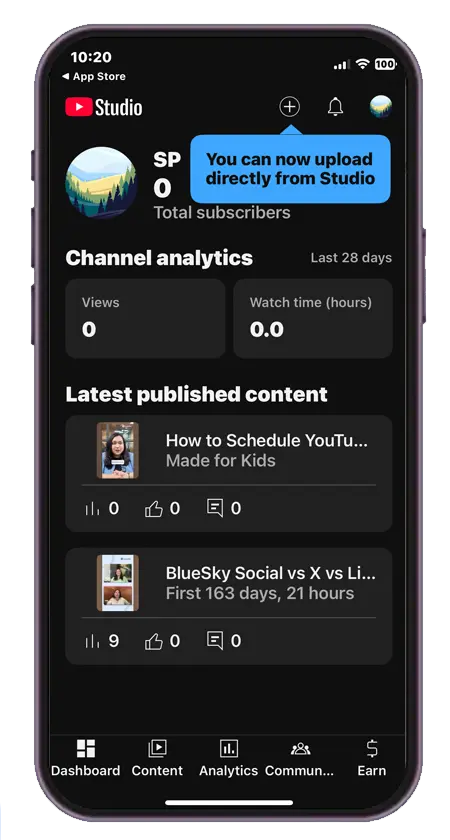
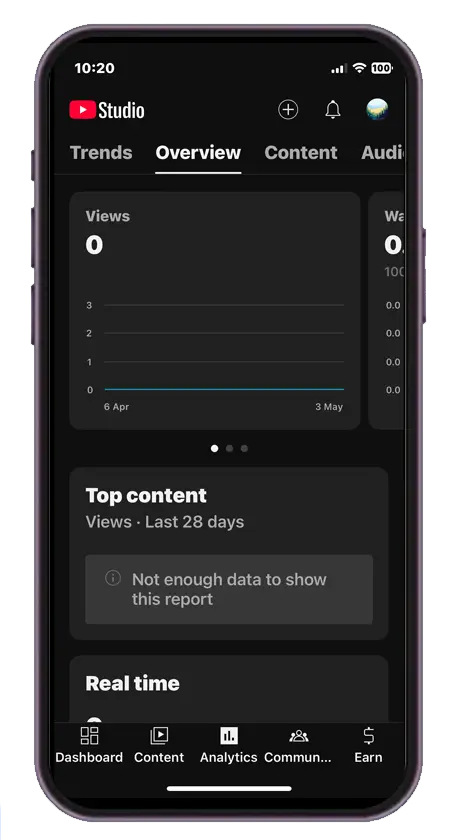
Step 3: You will also come across Overview, Trends, Content, and Audience. Select any of these based on the information you seek.
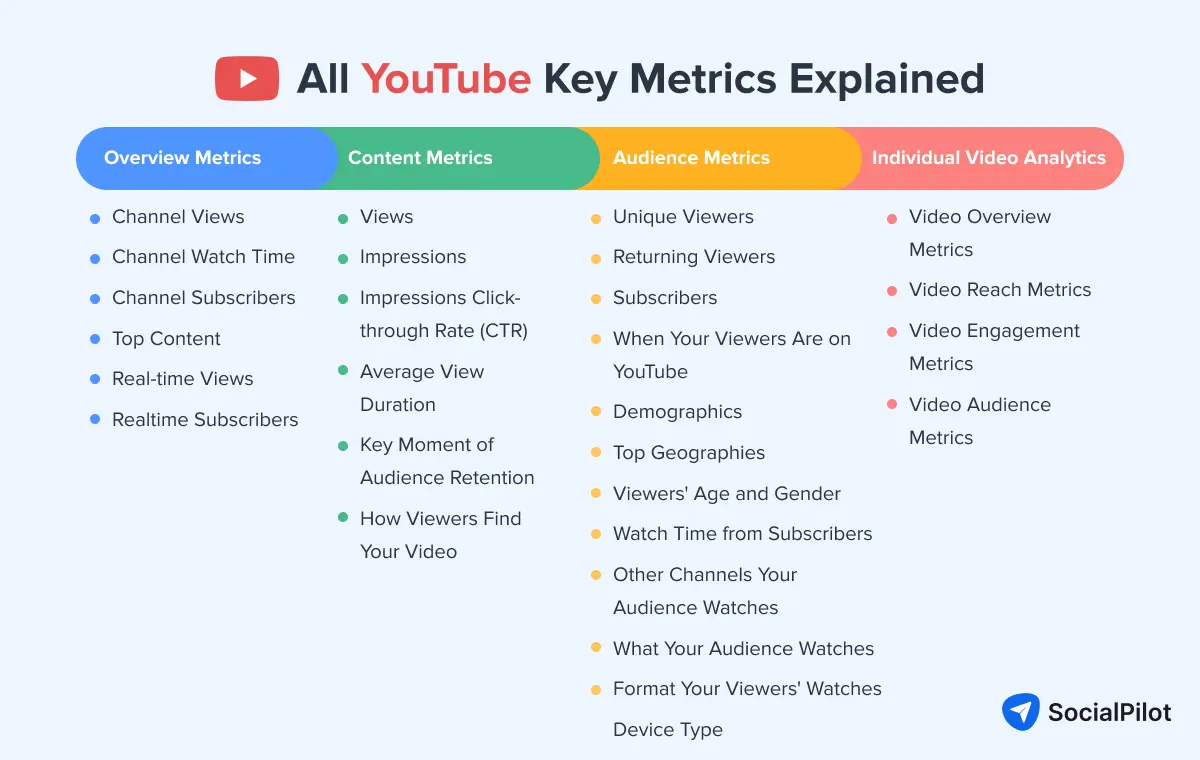
52 YouTube Key Metrics Explained
YouTube Studio Analytics dashboard and its metrics are divided into several tabs. Below is a detailed walkthrough of each tab and the metrics it shows.
Overview Metrics
The overview tab shows YouTube channel analytics. Here you can see the big picture of how your channel performs overall in the past 28 days.
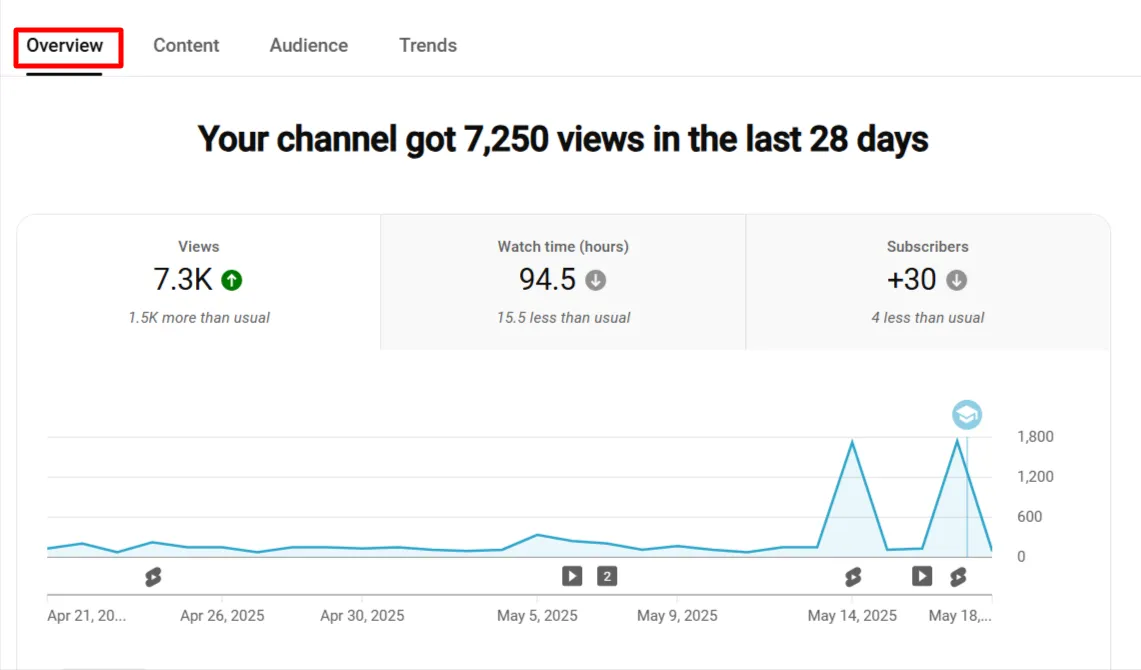
1. Channel Views: The total number of views on all videos in your channel. It helps gauge overall channel performance and popularity.
2. Channel Watch Time: The total time people have spent watching your videos. Higher watch time means YouTube’s algorithm sees your content as engaging.
3. Channel Subscribers: The total number of subscribers to your channel. This is a key indicator of your audience’s loyalty and engagement.
4. Top Content: Displays your most popular videos based on views, watch time, and engagement. Helps identify what content resonates most with your audience.
5. Real-time Views: The number of views your channel is getting right now. This gives a quick snapshot of your channel’s current performance.
6. Realtime Subscribers: Shows the number of new subscribers gained in real-time, helping you track sudden changes in interest.
Content Metrics
This section shows analytical data on how your overall content is doing.
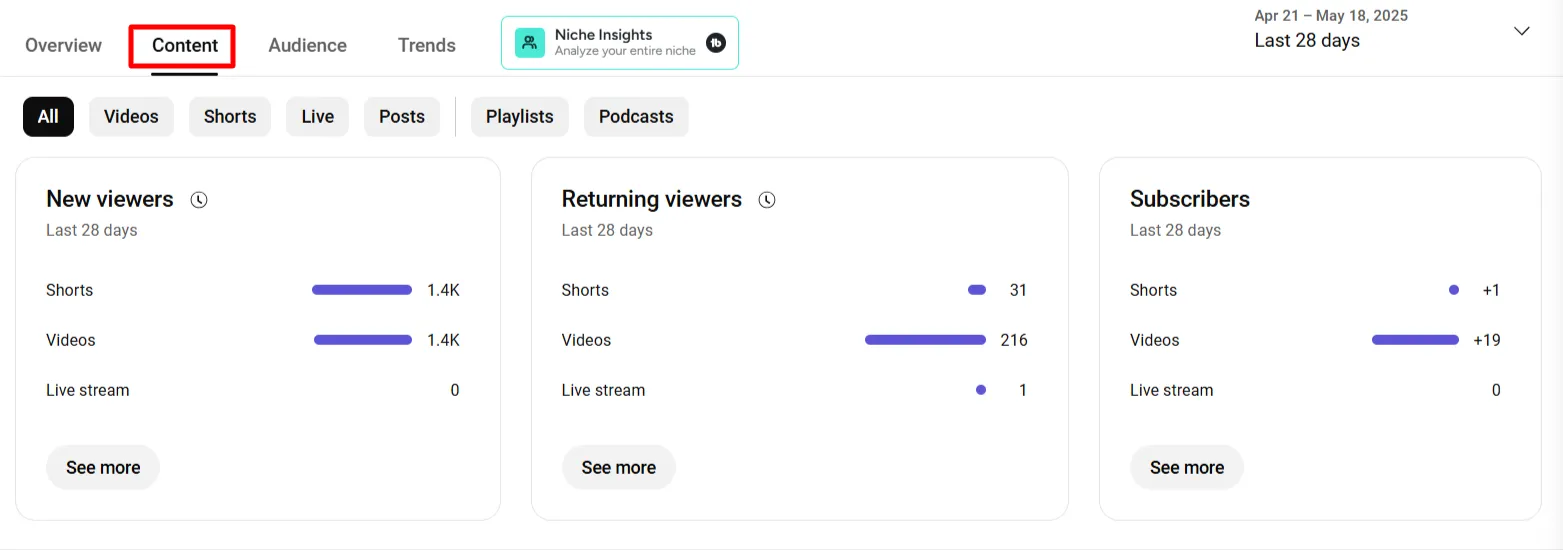
7. Views: Total views across your videos. Helps measure the reach and popularity of your content.
8. Impressions: The number of times your video thumbnails were shown to viewers. High impressions but low views suggest your thumbnail or title needs improvement.
9. Impressions Click-through Rate (CTR): The percentage of impressions that resulted in a view. This can be tracked using YouTube search analytics.
10. Average View Duration: The average time viewers watch your videos. Longer view durations suggest more engaging content.
11. Key Moment of Audience Retention: Shows where viewers drop off or skip. Helps identify the best and worst parts of your videos.
12. How Viewers Find Your Video: Shows search terms and sources directing traffic to your video. Helpful in optimizing keywords and titles.
Audience Metrics
This tab details the people watching your videos and what they find most relevant.

13. Unique Viewers: The number of individual users who watched your videos. A key metric for understanding how many people you’re reaching.
14. Returning Viewers: The number of viewers who return to watch your content again. High returning viewers indicate audience loyalty.
15. Subscribers: The number of people subscribed to your channel after watching. It measures your content’s ability to convert viewers into loyal followers.
16. When Your Viewers Are on YouTube: Tells you the times your audience is most active. Use this to schedule videos when viewers are most likely to watch.
17. Demographics: Shows the gender, age, and other attributes of your audience. Helps tailor content to your target demographic.
18. Top Geographies: Shows the locations where most of your views are coming from. This can help with region-specific content strategies.
19. Viewers’ Age and Gender: Further insights into your demographic, helping you customize your content for specific age groups or genders.
20. Watch Time from Subscribers: Indicates how much of your watch time comes from your subscribers. High watch time from subscribers suggests your content is consistently engaging.
21. Other Channels Your Audience Watches: Reveals channels with similar audiences. Great for collaboration and cross-promotion.
22. What Your Audience Watches: Shows the types of videos your audience watches on YouTube. It can guide you in creating content ideas.
23. Format Your Viewers’ Watches: Tells whether viewers watch on mobile, desktop, or TV. Helps optimize content for various devices.
24. Device Type: Details the devices your audience uses to watch your videos (e.g., phone, desktop, tablet). This helps in optimizing content for different platforms.
How to Check Individual Video Analytics on YouTube?
If you want to check the performance of a particular video content or YouTube Short, visit YouTube Studio and click on “Content” in the left menu bar.
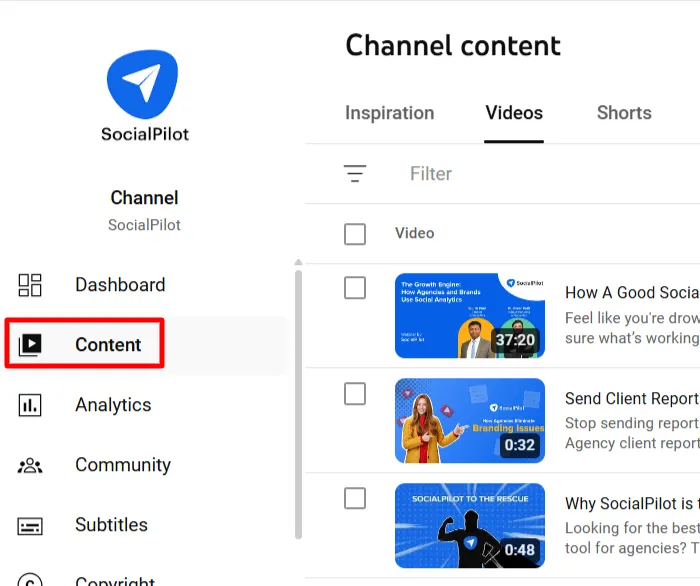
On hover over the video or Short and click on the “Analytics” icon on it.
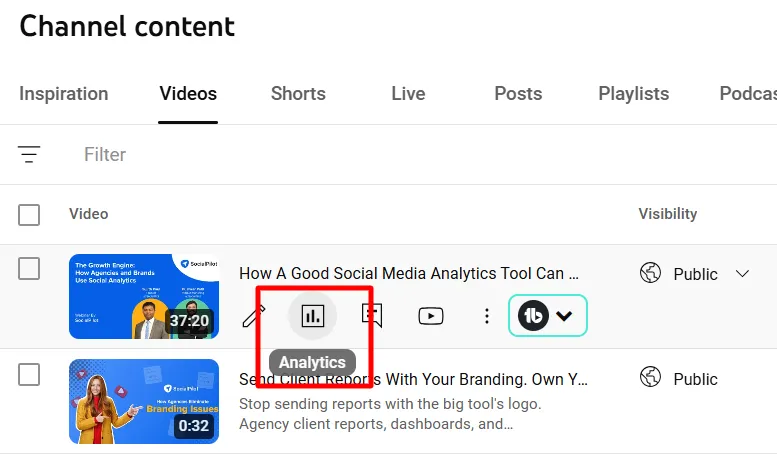
Now, you can see four different tabs on the top, namely, Overview, Reach, Engagement, and Audience, each with various performance data.
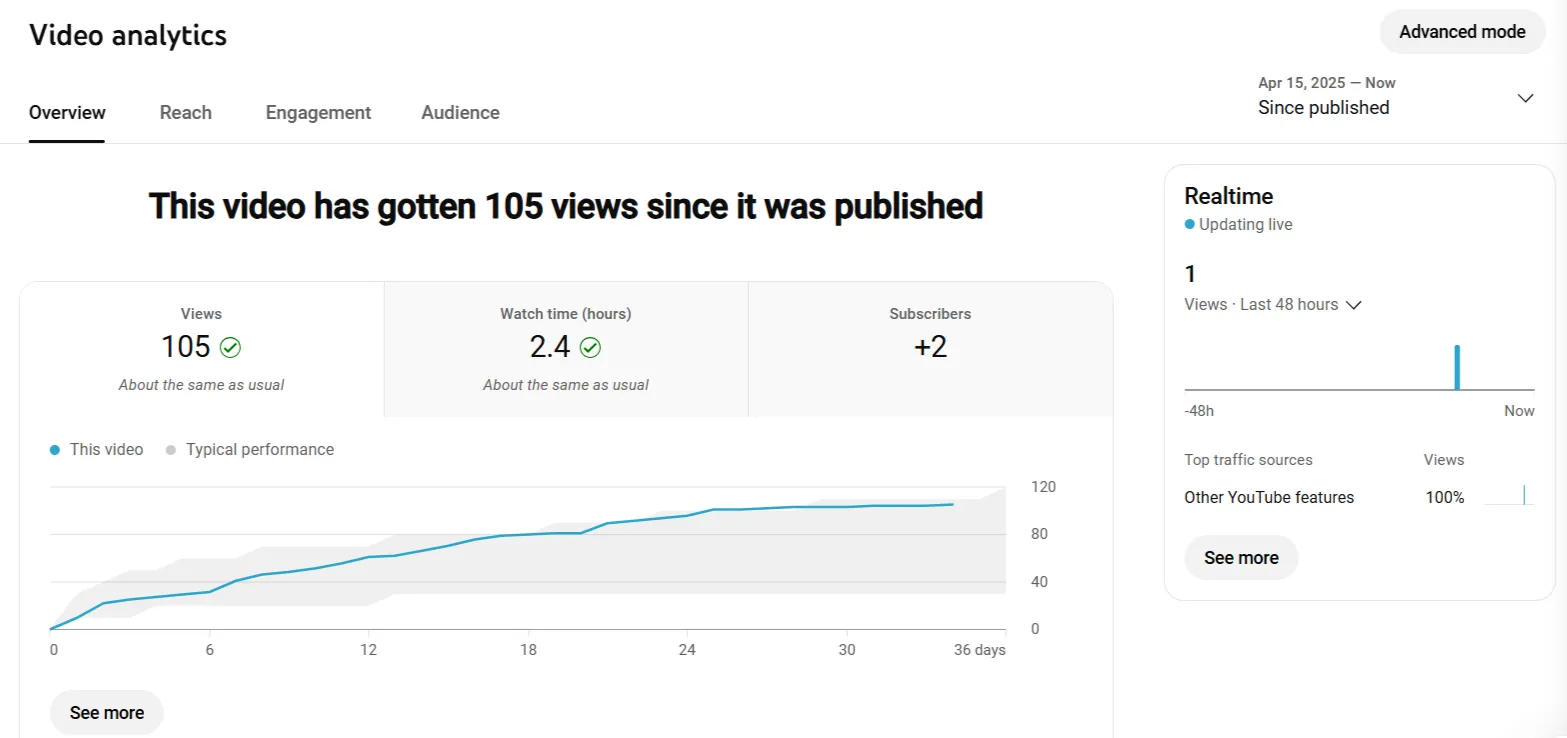
Here you will find all the YouTube video analytics metrics to track the growth of your individual video or Shorts.
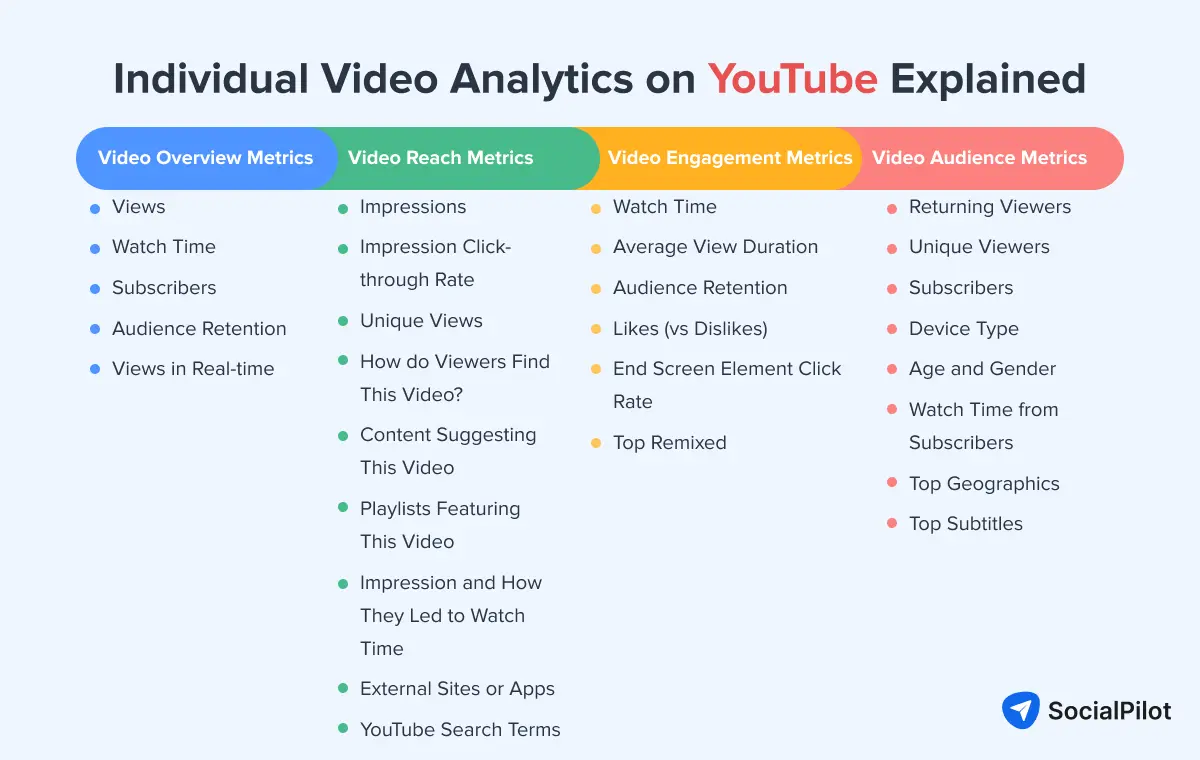
Video Overview Metrics
25. Views: The total number of views a video has received. It reflects the video’s reach.
26. Watch Time: The total minutes viewers have spent watching your video. Higher watch time can improve video ranking.
27. Subscribers: The number of subscribers gained from a particular video. Indicates how effective a video is in converting viewers to subscribers.
28. Audience Retention: Shows how many video viewers watch. High retention indicates that your video is holding viewer interest.
29. Views in Real-time: Displays how many views a video is getting at that moment. It gives an immediate idea of a video’s current performance.
Video Reach Metrics
30. Impressions: The number of times your video was shown in YouTube feeds. It’s a key measure of how often your video is exposed to new viewers.
31. Impression Click-through Rate: The percentage of impressions that resulted in views. High CTR means your video is grabbing attention effectively.
32. Unique Views: The number of distinct users who watched your video. Helps measure reach and audience size.
33. How do Viewers Find This Video? Identifies the sources (e.g., search, suggested videos) that brought viewers to your video. Helps optimize video promotion strategies.
34. Content Suggesting This Video: Shows other videos that are recommended by your video. Great for finding opportunities for more visibility through YouTube’s algorithm.
35. Playlists Featuring This Video: This shows if your video is included in playlists. This can help boost its discoverability.
36. Impression and How They Led to Watch Time: Analyzes the relationship between impressions and actual watch time. Helps you understand the impact of thumbnails and titles.
37. External Sites or Apps: The traffic your videos receive from sources outside of the YouTube platform itself.
38. YouTube Search Terms: Displays the search keywords leading to your video. Key for optimizing your SEO strategy.
Video Engagement Metrics
39. Watch Time: Total watch time for the video. Helps measure how engaging your content is.
40. Average View Duration: How long viewers stay on average. Higher view duration indicates more compelling content.
41. Audience Retention: Measures how well your video holds viewers’ attention—shows where they drop off and helps with content refinement.
42. Likes (vs Dislikes): Shows your video’s number of likes and dislikes. More likes generally signal positive reception.
43. End Screen Element Click Rate: The percentage of viewers clicking on elements in the end screen (e.g., links, video suggestions). Indicates how engaging your end screen elements are.
44. Top Remixed: Shows which videos are being remixed or reused by others. It can provide insight into how viral or shareable your content is.
Video Audience Metrics
45. Returning Viewers: The number of viewers returning to watch more of your content. Indicates viewer loyalty.
46. Unique Viewers: The number of distinct users who have watched your video. Helps gauge the reach.
47. Subscribers: The number of subscribers gained through a video. High subscriber numbers indicate that the video is engaging enough to prompt subscriptions.
48. Device Type: The devices your audience uses to watch videos. Helps in optimizing content for different devices.
49. Age and Gender: Gives a breakdown of the age and gender demographics of your viewers. Crucial for targeted content creation.
50. Watch Time from Subscribers: Shows how much of your video’s total watch time comes from subscribers. Higher values suggest strong engagement from loyal viewers.
51. Top Geographics: The locations where your video is being watched. Helps with geo-targeting strategies.
52. Top Subtitles: Shows which subtitle languages are used by viewers. Helpful for understanding your global reach and providing translations for broader audiences.
Still struggling to read analytical data inside YouTube Studio?
Listen to Brock Johnson, CEO of InstaClubHub, explain in our YouTube Masterclass how to check and understand your YouTube analytics.
How to Use YouTube Analytics Data Strategically for Growth?
1. Spot Underperforming Content
Spotting underperforming content involves identifying videos that aren’t generating the expected views, engagement, or watch time. These videos might not rank well in search results or suggested feeds, causing them to miss potential exposure.
Key Actions Include:
- Identifying videos that are not resonating with the audience.
- Making corrections early, ideally within the first week of release, to optimize performance.
This strategy is critical because underperforming videos can hinder channel growth.
YouTube’s Algorithm favors videos with good initial performance. Videos with poor early performance will likely stay underperforming unless adjustments are made.
Adjusting titles, descriptions, and thumbnails can lead to a 20-30% increase in CTR (Click-Through Rate), improving visibility and engagement.
Metric to Monitor:
- Views
- Watch Time
- CTR
How to find underperforming content?
- Monitor performance in the first 48-72 hours after posting.
- Adjust video metadata: Update titles, descriptions, and thumbnails to make the video more appealing.
- Keyword Optimization: Align keywords with trending topics for better discoverability.
- Cross-Promotion: Promote underperforming videos or high-performing videos on other social media channels.
The sooner you identify underperformance, the more time you have to optimize and improve the video.
2. Adjust Publishing Schedule Based on Traffic Patterns
Adjusting your publishing schedule based on traffic patterns increases early engagement and improves the chances of your video being recommended by YouTube’s algorithm. The goal is to time your releases for maximum visibility and interaction.
- Timing is key: Videos published at optimal times can see a 30-50% higher initial engagement rate.
- Boosts organic reach: YouTube prioritizes videos with high early engagement, promoting them in recommended sections.
How to adjust the publishing schedule?
- Identify peak times: Go to the “Audience” tab in YouTube Analytics and check the “When Your Viewers Are on YouTube” section.
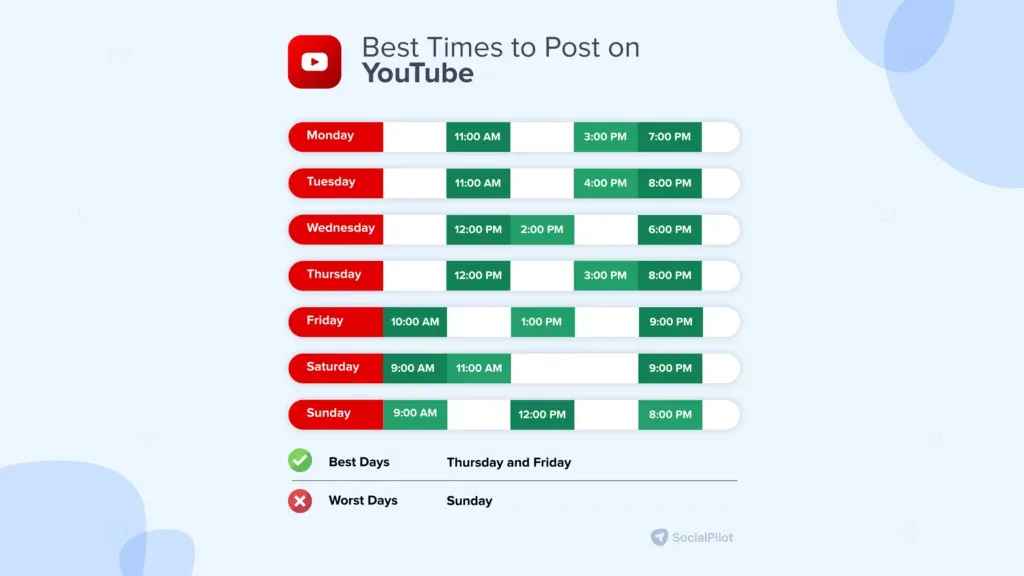
- Schedule uploads: Aim to release videos during peak traffic hours. Here is a generic best time to post on YouTube:
- Experiment: Test different posting schedules and track performance to find your ideal time slot.
Metric to Monitor:
- When Your Viewers Are on YouTube
- Views & Watch Time
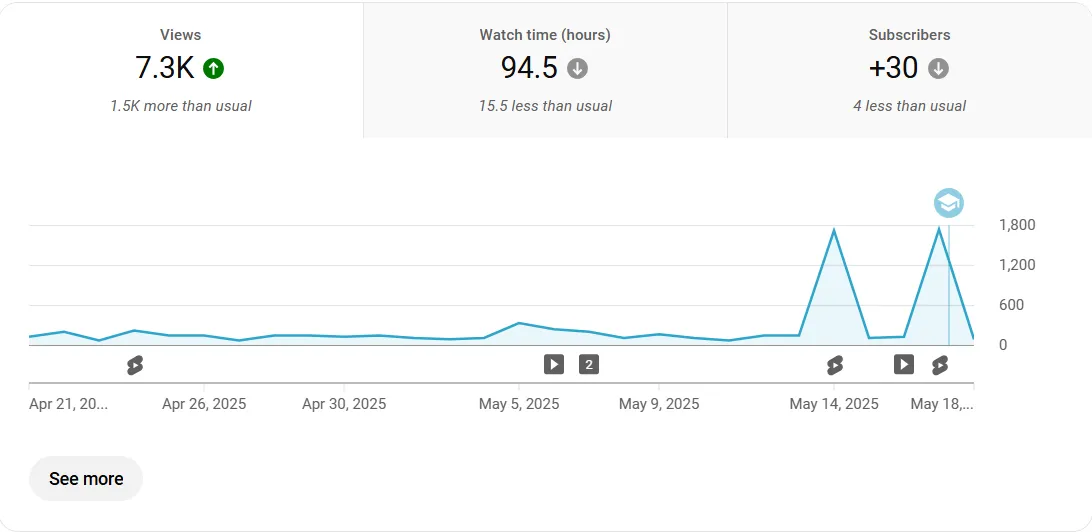
Monitor these metrics to determine optimal video release times and adjust your schedule. If you notice a low CTR during non-peak hours, it’s time to shift your timing.
The best time to use this method is the first 24-48 hours, crucial for building momentum.
Adjusting your publishing schedule ensures your videos reach the right audience at the right time, maximizing engagement.
Why guess when to post?
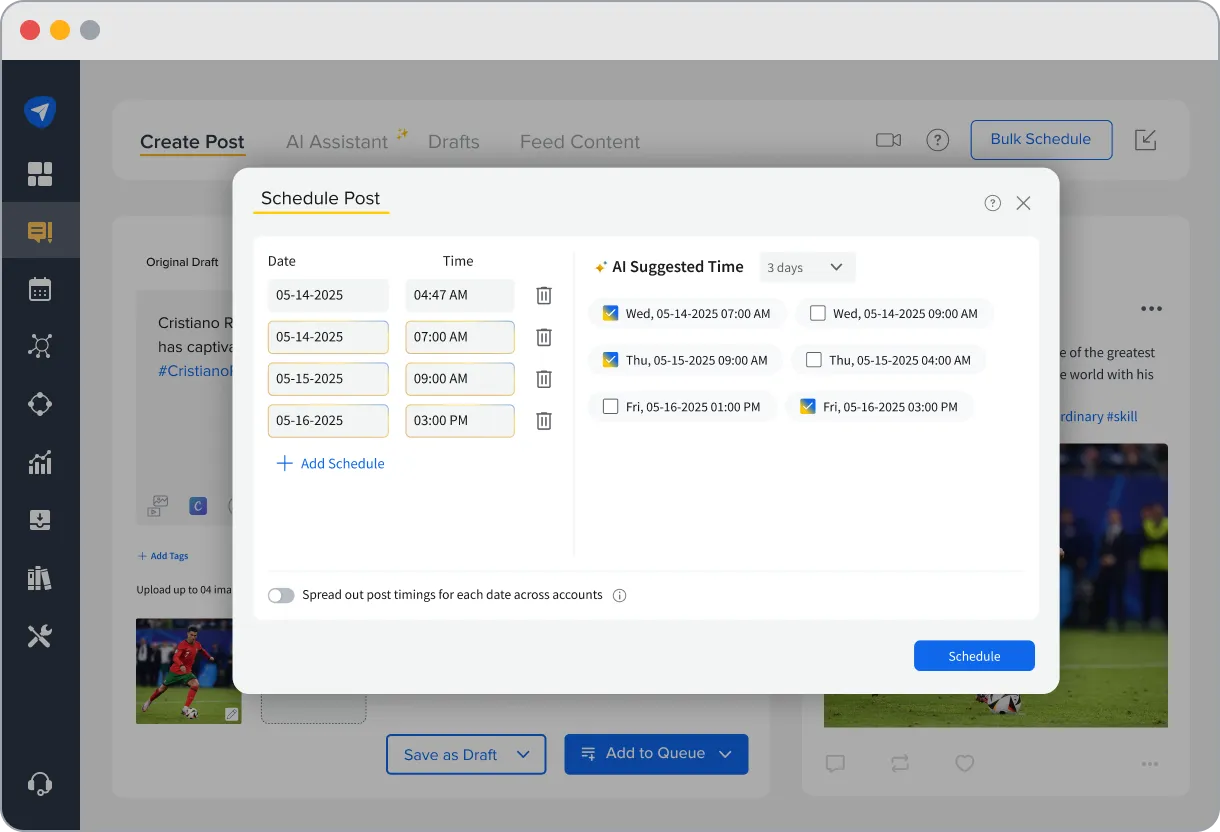
SocialPilot’s AI Suggested Time for Publishing studies when your audience is most active and recommends the perfect moment to schedule and post your videos, helping you get maximum views and engagement every time.
- Data-Driven Recommendations
- Platform-Specific Insights
- Flexible Scheduling
3. Identify Audience Drop-Off Points
Audience drop-off points refer to moments in a video where viewers stop watching or skip to another video.
These drop-offs often occur during transitions, lengthy explanations, or irrelevant content.
YouTube’s Audience Retention feature allows marketers to pinpoint exact drop-off moments and assess whether the issue concerns content appeal or technical aspects like pacing or editing.
Why is retaining the audience important?
- YouTube rewards videos with higher retention, boosting rankings and visibility.
- Higher retention rates make videos more likely to appear in recommended feeds, increasing reach.
- Studies suggest that a retention rate above 70%-85 % is optimum for seeing an increase in views on videos.
Hear Marcus Jones explain the strategy to analyze and increase the retention rate of your underperforming YouTube Shorts.
Early identification of drop-off points enables video re-editing. Focus on keeping content engaging by removing or condensing sections that cause viewers to lose interest.
Metric to Monitor:
- Audience Retention Metrics
Example: A noticeable drop after 60 seconds signals that the intro or early content isn’t captivating enough.
How to improve the retention rate?
- Tightening video introductions.
- Removing long-winded explanations.
- Adding engaging visuals to maintain interest.
- Re-positioning calls-to-action or making them more compelling if they coincide with drop-off points.
- Using annotations and end screens to guide viewers to related videos at key drop-off moments.
This strategy is most effective during the first 48 hours after uploading a video, as this is when most initial views will occur.
4. Optimize Titles/Thumbnails Based on CTR
Optimizing titles and thumbnails is a powerful strategy for improving your video’s Click-Through Rate on YouTube.
CTR measures how often a video is clicked compared to how often it’s shown. A high CTR signals to YouTube that your content is engaging and gets prioritized in search results and recommendations.
What can you do to improve CTR?
- Titles: Make them curiosity-driven, using targeted keywords.
- Thumbnails: Use bold text, contrasting colors, and compelling visuals that stand out in the feed and are the right size for thumbnails.
Benefits of this strategy:
- Direct impact on how often your video is clicked and its organic reach.
- YouTube promotes videos with higher CTRs, increasing their visibility.
TubeBuddy’s study showed a 40% increase in CTR after optimizing thumbnails and titles.
Metric to Monitor:
- Click-Through Rate
How to improve CTR?
- A/B Testing: Test different variations of titles and thumbnails to see what works best.
- Use Tools: TubeBuddy or Canva to design engaging thumbnails. Use targeted keywords in your titles based on audience search behavior.
- Regularly check CTR and adjust based on results.
5. Focus on Strong CTAs (Calls to Action)
A Call to Action prompts your audience to take a specific action. In YouTube videos, strong CTAs help drive engagement and encourage viewers to stay connected with your content or channel.
CTAs should be clear, actionable, and aligned with the video’s goals. Place CTAs at the video’s beginning, middle, and end for maximum impact.
A clear and consistent CTA can significantly boost engagement. Studies show that videos with CTAs have up to 20% higher engagement rates than those without.
The benefits of strong CTAs:
- Increased visibility: YouTube’s algorithm prioritizes videos with high engagement, meaning likes, comments, and shares can improve your video’s ranking.
- Increased subscriber growth: Channels like Ryan’s World successfully use CTAs to grow their audience and maintain high engagement.
- Aligned with goals: Whether you aim to grow subscribers, increase watch time, or generate traffic, CTAs guide viewers to take the desired actions.
Metrics to Monitor:
- Likes
- Comments
- Shares
- Subscribers Gained
- Impression Click-through-rate
These metrics help measure the effectiveness of your CTAs in building a loyal and engaged audience.
How to create strong CTAs?
Maximize the effectiveness of your CTAs with these tips:
- Be Specific: Instead of a simple “like the video,” say, “If you enjoyed this tutorial, give it a thumbs up!”
- Strategic Placement: Position CTAs at key points.
- Use Visual and Verbal Cues: Combine a spoken CTA with on-screen graphics or animations to make it more noticeable.
- Create Urgency: Phrases like “subscribe now” or “click before it’s too late” can push hesitant viewers to act.
Some compelling CTA examples:
- “Don’t forget to hit that subscribe button for more content!”
- “Leave a comment below to share your thoughts!”
- “Check out the link in the description for more details!”
When to Use CTAs?
The best times to incorporate CTAs are:
- At the beginning: Set expectations for viewers immediately (e.g., encourage subscriptions or bell notifications).
- In the middle: Engage viewers during longer videos, especially when they might lose attention.
- At the end: Make a final, compelling request as viewers prepare to leave.
Placing CTAs strategically throughout your video increases the chances of prompting viewers to take the desired action and helps grow your channel organically.
3 Best YouTube Analytics Tools
When growing your YouTube channel, having the right analytics tools can make all the difference. Tracking video performance, understanding your audience, and spotting growth opportunities help you create smarter content and boost engagement.
But with so many options out there, which tools should you trust?
Here’s a quick rundown of the three best YouTube analytics tools that can give you powerful insights, from deep-dive video stats to audience behavior.
SocialPilot is an essential YouTube analytics tool, offering in-depth insights into video performance, audience behavior, and growth patterns.
Engagement Insights and Trends
SocialPilot tracks likes, shares, comments, and views across both regular videos and Shorts. It provides detailed performance metrics like watch time and audience retention, allowing me to identify top-performing content and adjust my strategy accordingly.
Audience Demographics and Growth
The tool gives valuable data on subscriber growth, demographics, and geographical location. I can also track the devices and operating systems viewers use, optimizing content for mobile, desktop, or smart TVs.
SEO and Keyword Tracking
As YouTube is a top search engine, SocialPilot tracks the keywords driving traffic to videos, helping me optimize content for search visibility. It also provides referral traffic insights, showing where views are coming from.
Advanced YouTube Reporting
Custom reports are easy to generate, whether for one or multiple channels. SocialPilot also offers automated report delivery, ensuring my team stays updated without manual effort.
Multi-Account Reporting
Managing multiple YouTube channels is effortless with multi-account reporting, consolidating data into a single, streamlined report.
In short, SocialPilot is a powerful tool for optimizing YouTube strategy and maximizing performance.
2. YouTube Analytics
YouTube Analytics is a native tool that YouTube uses to track video performance, audience demographics, watch time, and engagement metrics. It’s ideal for YouTube creators and agencies aiming to grow a channel organically.
YouTube insights help refine your content strategy, identify high-performing videos, and better understand audience preferences.
Limitations of YouTube Analytics
While YouTube Analytics offers powerful insights, it has some limitations:
- It’s restricted to the YouTube platform, so you can’t track cross-platform performance or easily integrate data with other tools.
- Real-time data is not as detailed, and new users may find the interface overwhelming.
In summary, YouTube Analytics is a solid tool for platform-specific insights, but it lacks the flexibility and ease of integration that marketers might need for a more comprehensive view of their content’s performance.
3. Google Analytics
Google Analytics is a powerful tool for tracking website performance, including how users find your site, what content they engage with, and how long they stay. When applied to YouTube, it tracks traffic from YouTube videos to your website, offering valuable insights into referral traffic, user behavior, and conversions.
Drawbacks of Google Analytics for YouTube
- It lacks YouTube-specific data such as video watch time, audience retention, and engagement metrics, which are essential for content creators.
- Complicated setup: Setting it up correctly can be challenging, especially for those unfamiliar with web analytics.
- Requires manual integration with YouTube to track traffic, and without proper setup, it may not provide complete insights into your video performance.
In short, while Google Analytics offers valuable website data, it doesn’t provide the deep insights that YouTube creators need for managing and optimizing their content effectively.
Start Analyzing Your Way to Success!
For social media marketers managing client YouTube accounts, it’s not just about creating engaging content; it’s about making data-driven decisions that fuel growth. YouTube isn’t just an entertainment platform; it’s a serious business opportunity, and a smart, data-backed strategy is key to success.
You need metrics, insights, and a robust social media management tool that can help track and optimize performance across multiple channels.
SocialPilot is the tool to take your social media strategy to the next level. It helps you easily manage, analyze, and report on YouTube performance, enabling you to make informed decisions that drive results.
Start using SocialPilot today with a free trial and see how it can streamline your YouTube management and help you achieve your client goals.
