Over the past two decades, social media has transformed from niche online communities into a global network of over 5.3 billion users. What started as a way to stay in touch has become a powerful driver of communication, commerce, and culture.
Here’s a Fun Fact: The average social media user scrolls through about 300 feet of content on their phone every day — that’s roughly the height of The Statue of Liberty! That’s how deeply social platforms are now stitched into our daily lives, reshaping how we connect, learn, and buy.
But with platforms multiplying, features evolving, and user behavior shifting by the day, how do you stay ahead of the curve?
The answers lie in data. And in understanding what that data actually means for marketers, this blog is your go-to guide of what is working, what is fading, and what is coming next in the world of social media.
So, whether you are planning your next campaign, refining your content strategy, or just love a good stat fix, let us break down the numbers that matter.
Social media is now a global constant. As of April, 5.31 billion people are active on social platforms, which is 64.7% of the world’s population. This isn’t just widespread; it’s almost universal among internet users, with 94.2% of internet users now on social media.
Here’s how the landscape has evolved and what it means in real numbers:
- Social media users grew by 4.7% YoY, which is an average of 7.6 new users every second.
- Over the past decade, the growth has been remarkable, from over 2 billion users in 2015 to 5.31 billion people. Social media adoption has more than doubled in ten years.
Year Users in Billion YoY Growth (%) 2025 5.31 +5.4% 2024 5.04 +5.9% 2023 4.76 +3.0% 2022 4.62 +10.0% 2021 4.20 +13.2% 2020 3.71 +7.2% 2019 3.46 +8.1% 2018 3.20 +14.7% 2017 2.79 +20.8% 2016 2.31 +11.1% 2015 2.08 - The average daily time spent on social media is 2 hours and 20 minutes.
- A typical user actively visits 6.7 social platforms per month, showing a clear preference for multi-platform usage.
- The world collectively spends over 14 billion hours per day on social media.
- Platform-wise usage varies, but Facebook, YouTube, Instagram, and TikTok lead the global user charts.

Note: User figures across platforms are based on the most recent data. While some numbers reflect total monthly active users, others are based on advertising reach — which may be lower than total users due to targeting limitations or inactive accounts. Always consider these differences when comparing platform scale.
- China (1.1B), India (462M), and the U.S. (239M) are the top three countries by total social media users.
- Social media penetration(How widely Social media is used across different countries) (latest statistics):
Country Social Media Penetration Saudi Arabia 102% UAE 96% South Korea 94% Singapore 88% Malaysia 84% Hong Kong 83% Spain 82% Sweden 81% Netherlands 80% Austria 80% - Social media is still growing. From over 5 billion users in 2024, the number is projected to cross 6 billion users by 2028.
With billions logging in daily and spending hours across multiple platforms, the real question becomes — where are they actually spending that time, and how is that time turning into sales?
Which Platforms Are Winning Consumer Attention in 2025?
Social media isn’t just where people scroll — it’s where they discover, engage, and shop. For marketers, this shift is critical. This year, platforms like TikTok, Instagram, and Facebook are driving more than just traffic — they’re influencing real buying behavior.
With 82% of consumers using social platforms for product research and nearly half of purchases being influenced by creators, it’s clear: attention is currency, and the platforms earning it are rewriting the rules of commerce.
Here are the key signals that show where consumer attention — and buying intent — is strongest:
- Gen Z leans into TikTok (55%) while Millennials prefer Facebook (52%).
As per Our TikTok Trends Report 2025 analysis of 1.5 million posts, TikTok isn’t just a content platform — it’s a discovery engine. With 1.59 billion monthly users and 135M in the U.S. alone, TikTok is where Gen Z now searches, shops, and sets cultural norms.

- The US social commerce market is estimated at $104 billion, projected to cross $150 billion by 2029.
- 48% of Gen Z consumers prefer discovering products through short-form videos like TikTok and Instagram Reels.
- Influencer impact remains massive, driving 49% of consumer purchases.
- 87% of sellers say social selling has positively impacted their business.
- Social network-driven sales now represent 17.11% of all online sales.
- 76% of consumers have purchased something after seeing it in a brand’s social media post.
- 53% of Americans shop on social platforms at least once a week.
- Mobile continues to dominate: $710 billion in US mobile ecommerce sales projected, making up over 44% of all ecommerce sales.
- Social is the starting point: 14% of consumers begin their online shopping journey on social media.

Now that we know where consumers are spending — and spending money — let’s break down who’s actually driving this behavior.
Social media continues to be dominated by younger audiences, with over 70% of users globally falling between the ages of 18 and 34. Gen Z (ages 18–24) alone makes up 36.2% of TikTok’s user base, while Instagram’s largest demographic is aged 25–34, accounting for 28.3% of U.S. users.
To give you a sharper snapshot of who’s on each platform — and how those demographics are evolving.

Note: This demographic distribution reflects how audience composition varies significantly across platforms. Visual discovery platforms like Pinterest and Instagram attract a higher share of female users, while networks like X, LinkedIn, and Bluesky are more male-dominant. These patterns reveal content and engagement nuances — but it’s worth noting that platform demographics continue to evolve, especially as new features and formats attract more diverse user segments.
With the “who” of social media clearly mapped out, let’s dive into the “how” — exploring how users are engaging with platforms in their daily routines and what that means for marketers.
Did you know that people across the globe collectively spend over 12 billion hours every day on social media? That’s not just casual browsing — it’s proof of how deeply integrated these platforms have become in how we connect, consume, and communicate.
From morning scrolls to late-night swipes, users are tapping into social media to stay informed, be entertained, get inspired, and increasingly, to discover and buy products. What’s evolving isn’t just how often we use social media — it’s why. Each platform serves a distinct purpose in a user’s daily rhythm.
Let’s look at the specific behaviors shaping how users engage with social platforms every day:
- 98.5% of Facebook users access the platform via mobile devices.
- TikTok users open the app over 344 times a month, averaging 11+ sessions per day.
- Globally, users spend over 27 hours per month on the YouTube mobile app.
- The average Bluesky visit lasts 10 minutes and 35 seconds.
- 57% of LinkedIn traffic comes from mobile devices.
- 7.8 billion total minutes spent on X/Twitter Daily.
- 82–85% of Pinterest usage is on mobile.
- Instagram users spent an average of 30 minutes daily on the app.
- The average Snapchat user spends 30 minutes on the app.
Now that we know how embedded social media is in everyday routines, the next step is understanding what truly captures users’ attention — and keeps them engaged.
What Type of Content Drives the Most Engagement?
In 2025, video continues to dominate, and short-form content is leading the charge. Whether it’s TikTok clips, Instagram Reels, or YouTube Shorts, users are engaging more with dynamic, immersive formats.
A standout stat: posts with videos on Instagram get 49% more engagement than photo posts, and on LinkedIn, video drives 5x more engagement than other formats. Even more impressively, educational creators on TikTok are seeing engagement rates of up to 9.5%.
Content that performs isn’t always the flashiest — it’s the most relatable, valuable, and format-optimized. Carousels, how-tos, polls, live streams — they all play a key role in increasing reach and interaction.
Engagement rates vary significantly across platforms and content types. Here’s how they stack up, visualized in the graphic below:

Note: Engagement rates vary widely by platform. Instagram leads due to interactive content formats, while TikTok and Pinterest benefit from personalized, discovery-driven use. Lower rates on Facebook and X reflect content saturation, though these platforms still offer strong value in reach or niche engagement.
Beyond format, user behavior across platforms reveals what truly hooks attention — whether it’s laughter, inspiration, or real-time interaction. Here are some additional platform-specific insights that highlight what content types users are most actively engaging with in 2025:
- TikTok leads for entertainment, with 79.6% of users seeking funny or engaging videos.
- Instagram dominates visual sharing with 69.8% of users post photos or videos.
- Facebook remains a hub for connection, with 72.1% using it to message friends and family.

Note: These insights reflect how users interact with each platform beyond passive scrolling. While some prioritize entertainment or shopping, others lean into messaging or staying informed — making it essential to align content strategy with platform-specific behavior.
Crafting engaging content matters — but what’s equally important is how businesses are leveraging that content to drive real-world results. Let’s skip ahead to explore how brands are using social media strategically.
Social media has evolved into more than just a marketing channel — it’s now a core business engine. Over 87% of businesses report that social media has positively impacted their business, from discovery and engagement to conversion and long-term retention. Brands across industries are using platforms not only to promote but to build direct, transactional relationships with their audiences.
To visualize how each platform contributes to business success, check out the graphic below highlighting platform-wise revenue generation and growth .

Here are more business-driven stats that spotlight how organizations are tapping into the power of social media:
- Facebook Marketplace is used by over 250 million sellers globally, offering a hybrid of community commerce and traditional ecommerce.
- 90% of Instagram users follow at least one business account, and 61% use the platform to discover new products.
- LinkedIn is home to over 67 million companies, and 4 out of 5 users drive business decisions, making it essential for B2B lead generation.
- TikTok helped small and medium-sized businesses generate $14.7 billion in 2024 alone.
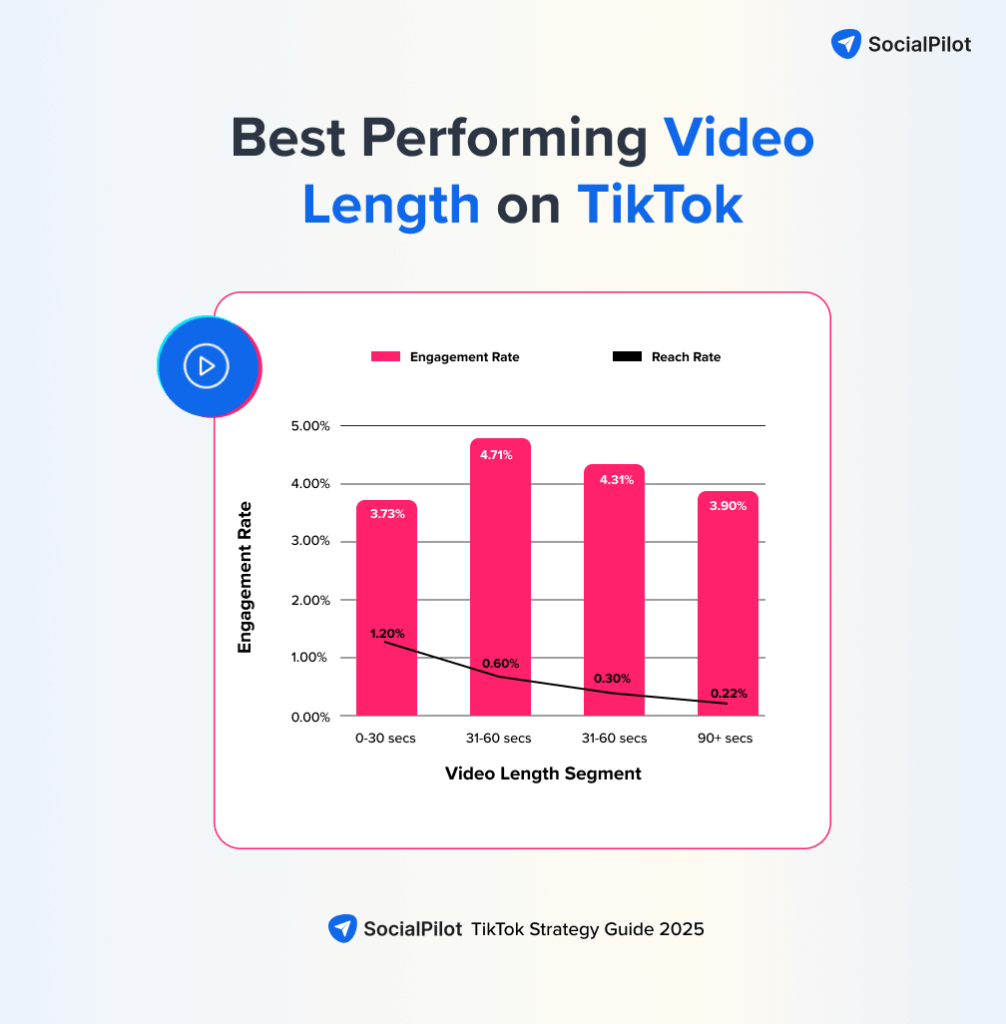
What’s driving that success? According to SocialPilot’s 2025 TikTok Trends Report, business accounts that post weekly — especially with videos in the 31–60 second sweet spot — outperform peers, achieving up to 2.11% reach and 3x more engagement than horizontal formats.

- Pinterest drives 33% more traffic to ecommerce sites than Facebook and offers 2x higher ROAS than other platforms.
- Snapchat+ subscription brings an annual revenue of approximately $500 million.
- YouTube is used by 51.6% of marketers primarily for brand awareness, with 43.3% reporting improved product visibility.
With social platforms now central to sales, service, and storytelling — it’s no longer a question of if your business should be online, but how effectively you’re using it. Up next, let’s break down which platforms are delivering the strongest ad reach and ROI.
Which Platforms Offer the Best Ad Reach and ROI?
YouTube leads with the highest potential ad reach at 2.54 billion users, followed closely by Facebook at 2.28 billion. When it comes to ROI, Instagram and Pinterest are delivering some of the strongest returns, especially for ecommerce and visual-first brands.
With ad budgets rising across industries, marketers are prioritizing platforms that offer high visibility, precise targeting, and strong conversion potential.
Here are the key advertising stats worth knowing:
- Instagram’s ad revenue is forecast to hit $71 billion by the end of 2025, with Reels between 60–90 seconds driving 24% more shares.
- Facebook ads see an average CTR of 2.53% — one of the highest across platforms.
- Pinterest delivers 2x higher ROAS than Facebook and Instagram ads and reaches 340 million people via advertising.
- TikTok’s total global ad revenue is projected at $331.1 billion, with a 67% click-through rate on traffic campaigns.
- LinkedIn ads increase purchase intent by 33%, making it ideal for high-value B2B conversions.
- Snapchat ad reach hit 709 million users, and its advertiser base more than doubled in Q4 2024.
- X (formerly Twitter) is expected to generate $2.26 billion in global ad sales, with photo and video posts seeing the highest engagement.

From massive reach to laser-focused B2B targeting, social platforms in 2025 aren’t just ad spaces — they’re business growth ecosystems. Next, let’s explore where social media is headed next and the trends that will shape its future.
Social media is already moving at breakneck speed — but what’s coming next will challenge marketers to be sharper, faster, and more data-informed than ever. With audiences fragmenting, AI reshaping creation, and commerce blending directly into content, the next wave isn’t about more platforms — it’s about smarter strategy.
For a closer look at evolving patterns, don’t miss our breakdown of the Latest Social Media Trends shaping 2025 and beyond.
Here’s what’s already shifting and what marketers need to watch closely in the months ahead:
1. Rise of AI-Generated and Creator-Led Content
- 93% of marketers plan to increase or maintain investment in video content — especially short-form and AI-enhanced formats.
- AI tools are shaping content creation, recommendations, and campaign automation.
2. Social Commerce Is Becoming the Default
- The U.S. social commerce market is projected to exceed $150B by 2029.
- 76% of users say they’ve purchased a product they discovered in a brand’s social media post.
3. Fragmentation Is Driving Niche Communities
- The average user visits 6.8 platforms monthly, seeking more tailored content experiences.
- Emerging platforms like Bluesky and Discord communities are attracting audiences looking for tighter connections and less algorithmic noise.
4. Messaging Is the New Marketing Channel
- Messaging-based platforms like WhatsApp Business and Messenger are seeing increased use in customer care, product discovery, and personalized offers.
- Expect more private, one-on-one interactions to dominate engagement strategies.
5. ROI, Attribution, and Ad Spend Efficiency Take Center Stage
- As CPMs and CPCs rise, marketers are doubling down on performance analytics, attribution tracking, and channel-specific ROI strategies.
- Ad budgets are shifting from broad reach to high-intent micro-targeting.
For deeper insights, explore our full statistics breakdowns for each platform:
Conclusion
The aforementioned social media statistics are more than just numbers—they are signals. They show where your audience is, what they care about, and how they are interacting with brands in 2025. Whether you are planning your next campaign, testing ad formats, or rethinking your posting strategy, this data gives you the clarity to act with confidence.
Managing all these insights effectively requires the right tool. That’s where SocialPilot’s social media management tool fits in by bringing scheduling, analytics, collaboration, and reporting together, so you can turn trends and insights into real growth.
So go ahead turn those stats into strategy and let us help you scale it.